|
Download Data (XLS File) |
|
||||||||
|
||||||||
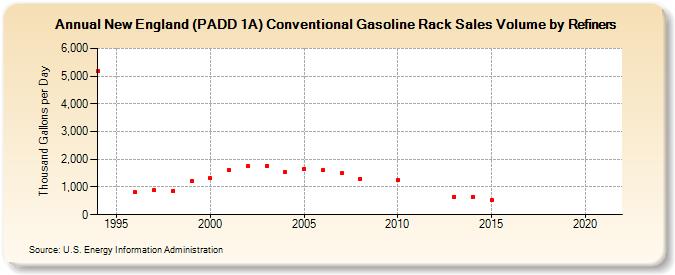
| New England (PADD 1A) Conventional Gasoline Rack Sales Volume by Refiners (Thousand Gallons per Day) | ||||||||
| Decade | Year-0 | Year-1 | Year-2 | Year-3 | Year-4 | Year-5 | Year-6 | Year-7 | Year-8 | Year-9 |
|---|---|---|---|---|---|---|---|---|---|---|
| 1990's | 5,184.2 | W | 801.6 | 877.2 | 859.3 | 1,207.3 | ||||
| 2000's | 1,310.7 | 1,605.5 | 1,741.7 | 1,750.5 | 1,556.7 | 1,657.9 | 1,596.6 | 1,494.3 | 1,302.7 | W |
| 2010's | 1,249.4 | W | W | 652.5 | 653.9 | 533.0 | W | W | W | W |
| 2020's | W |
| - = No Data Reported; -- = Not Applicable; NA = Not Available; W = Withheld to avoid disclosure of individual company data. |
| Release Date: 6/1/2022 |
| Next Release Date: TBD |