|
Download Data (XLS File) |
|
||||||||
|
||||||||
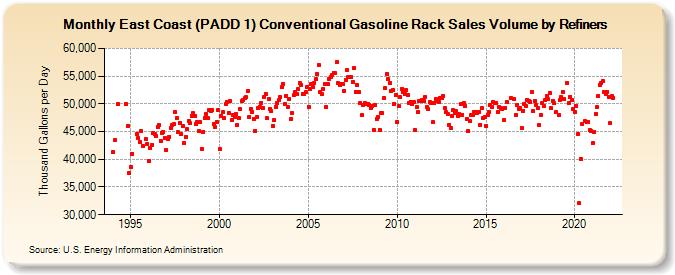
| East Coast (PADD 1) Conventional Gasoline Rack Sales Volume by Refiners (Thousand Gallons per Day) | ||||||||
| Year | Jan | Feb | Mar | Apr | May | Jun | Jul | Aug | Sep | Oct | Nov | Dec |
|---|---|---|---|---|---|---|---|---|---|---|---|---|
| 1994 | 41,283.2 | 43,402.9 | W | 49,879.6 | W | W | W | W | W | 49,989.5 | 46,091.4 | 37,468.0 |
| 1995 | 38,671.7 | 41,006.2 | W | W | 44,528.3 | 43,832.5 | 43,071.1 | 45,044.8 | 42,419.0 | W | 43,743.1 | 42,785.6 |
| 1996 | 39,713.9 | 42,044.0 | 42,590.4 | 44,654.6 | 44,507.6 | 44,240.3 | 45,854.7 | 46,139.6 | 43,381.6 | 44,757.8 | 44,897.4 | 43,907.5 |
| 1997 | 41,711.8 | 43,581.3 | 44,018.8 | 45,667.5 | 46,132.7 | 46,349.9 | 48,490.7 | 47,473.3 | 44,885.6 | 46,622.6 | 44,481.8 | 45,926.5 |
| 1998 | 42,880.8 | 44,093.9 | 45,445.1 | 46,864.4 | 46,460.1 | 47,809.6 | 48,288.4 | 47,849.2 | 46,382.2 | 46,695.0 | 45,025.4 | 46,685.1 |
| 1999 | 41,855.6 | 44,958.6 | 47,385.5 | 48,167.1 | 47,376.9 | 48,824.8 | 48,714.5 | 48,823.6 | 46,325.2 | 45,765.8 | 46,787.4 | 48,829.3 |
| 2000 | 41,786.6 | 47,842.5 | 48,438.6 | 47,366.5 | 49,963.1 | 50,390.2 | 48,381.4 | 50,445.5 | 47,010.6 | 48,019.1 | 47,702.4 | 48,147.9 |
| 2001 | 46,141.1 | 47,384.4 | 49,048.2 | 50,439.5 | 50,653.0 | 51,002.7 | 51,165.0 | 52,365.2 | 47,699.7 | 49,070.2 | 48,485.2 | 47,298.9 |
| 2002 | 45,161.1 | 47,581.9 | 49,176.0 | 49,492.8 | 50,169.7 | 49,232.3 | 51,237.3 | 51,816.9 | 47,378.0 | 50,843.6 | 49,005.5 | 48,656.6 |
| 2003 | 46,049.0 | 47,040.3 | 49,456.9 | 50,089.7 | 50,601.5 | 51,195.3 | 52,951.2 | 53,645.8 | 50,010.6 | 51,432.3 | 49,512.9 | 50,886.3 |
| 2004 | 47,287.6 | 48,350.0 | 51,503.8 | 52,200.6 | 51,769.7 | 52,662.0 | 53,783.1 | 53,467.7 | 51,819.3 | 51,744.9 | 52,068.6 | 53,061.9 |
| 2005 | 49,440.3 | 52,642.9 | 53,498.1 | 52,959.1 | 53,815.7 | 54,510.7 | 55,318.7 | 57,045.1 | 52,182.3 | 51,705.8 | 52,644.8 | 53,599.4 |
| 2006 | 49,455.0 | 53,535.9 | 54,563.5 | 54,906.4 | 55,113.4 | 55,641.9 | 55,487.3 | 57,523.2 | 53,750.2 | 53,428.1 | 53,487.0 | 53,498.3 |
| 2007 | 52,316.3 | 54,386.6 | 56,020.6 | 54,861.0 | 54,795.0 | 54,820.6 | 53,977.0 | 56,422.2 | 52,167.7 | 53,376.3 | 52,071.9 | 50,167.8 |
| 2008 | 47,981.0 | 49,749.1 | 50,072.5 | 49,990.0 | 50,026.4 | 49,835.7 | 49,322.7 | 49,564.9 | 45,279.5 | 49,736.9 | 47,298.6 | 47,659.9 |
| 2009 | 45,350.2 | 48,369.3 | 48,345.5 | 51,078.8 | 52,837.7 | 55,405.6 | 54,482.1 | 53,819.0 | 52,314.8 | 52,511.4 | 50,008.1 | 51,587.5 |
| 2010 | 46,729.1 | 49,628.1 | 51,164.1 | 52,763.0 | 52,121.8 | 51,739.9 | 52,516.1 | 51,571.8 | 50,207.0 | 50,407.7 | 49,978.9 | 50,392.7 |
| 2011 | 45,236.7 | 49,364.1 | 48,613.1 | 50,456.1 | 50,488.8 | 50,763.3 | 50,428.0 | 51,307.6 | 49,486.9 | 49,063.8 | 50,267.4 | 50,072.7 |
| 2012 | 46,650.7 | 50,065.4 | 50,846.9 | 50,560.5 | 50,396.6 | 51,014.3 | 51,000.3 | 51,426.3 | 49,312.7 | 48,455.2 | 48,190.2 | 46,227.4 |
| 2013 | 45,653.8 | 47,842.5 | 48,850.4 | 48,362.7 | 48,646.8 | 47,830.7 | 48,129.9 | 49,940.8 | 48,072.4 | 50,161.7 | 49,599.7 | 47,280.3 |
| 2014 | 45,056.4 | 46,849.5 | 48,042.0 | 47,991.0 | 48,486.8 | 48,579.0 | 48,338.9 | 48,589.3 | 46,231.0 | 49,195.9 | 47,487.8 | 47,610.2 |
| 2015 | 46,058.9 | 47,917.3 | 48,589.5 | 49,841.1 | 49,491.2 | 50,244.5 | 50,197.6 | 50,189.8 | 48,560.5 | 49,411.1 | 49,192.1 | 49,044.9 |
| 2016 | 47,152.1 | 49,242.7 | 50,338.7 | W | W | 50,970.2 | W | 50,870.9 | 48,073.0 | 49,709.0 | 49,129.2 | 49,315.1 |
| 2017 | 45,715.3 | 48,752.2 | 50,037.3 | 49,524.0 | 50,750.9 | 50,582.4 | 50,286.9 | 52,079.8 | 48,676.0 | 50,481.9 | 49,825.3 | 49,251.9 |
| 2018 | 46,169.1 | 48,068.2 | 50,065.6 | 49,677.8 | 50,615.9 | 51,434.2 | 50,835.3 | 52,013.3 | 49,216.8 | 50,558.9 | 50,088.6 | 48,472.4 |
| 2019 | W | 48,036.6 | 50,667.2 | 51,229.7 | 52,204.2 | 50,875.0 | W | 53,820.6 | 50,093.2 | 51,264.7 | 50,605.5 | 48,989.9 |
| 2020 | 48,440.8 | 49,599.8 | 44,556.9 | 32,030.3 | 40,088.4 | 46,408.1 | W | 46,857.6 | 46,695.3 | 46,811.0 | 45,231.4 | 45,101.5 |
| 2021 | 42,910.3 | 44,935.6 | 48,209.5 | 49,388.0 | 51,427.3 | 53,474.5 | 53,731.2 | 54,082.5 | 52,054.3 | 51,828.0 | 52,200.3 | 51,217.9 |
| 2022 | 46,456.0 | 51,400.7 | 51,117.6 | |||||||||
| - = No Data Reported; -- = Not Applicable; NA = Not Available; W = Withheld to avoid disclosure of individual company data. |
| Release Date: 6/1/2022 |
| Next Release Date: TBD |