|
Download Data (XLS File) |
|
||||||||
|
||||||||
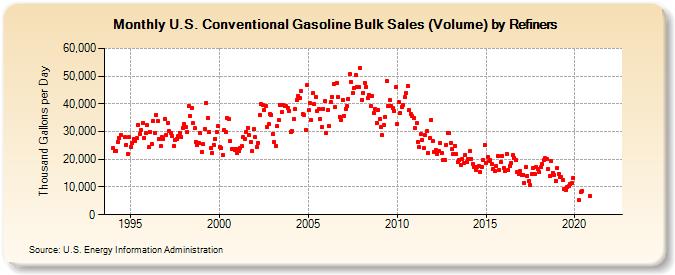
| U.S. Conventional Gasoline Bulk Sales (Volume) by Refiners (Thousand Gallons per Day) | ||||||||
| Year | Jan | Feb | Mar | Apr | May | Jun | Jul | Aug | Sep | Oct | Nov | Dec |
|---|---|---|---|---|---|---|---|---|---|---|---|---|
| 1994 | 23,929.2 | 23,109.1 | 23,153.9 | 26,306.9 | 27,795.8 | 28,704.4 | W | W | 27,898.8 | 25,284.5 | 21,918.0 | 27,917.3 |
| 1995 | 24,529.2 | 26,023.8 | 27,404.1 | 26,540.1 | 27,558.2 | 32,447.1 | 29,075.9 | 30,517.2 | 33,122.4 | 27,707.0 | 29,321.1 | 32,336.6 |
| 1996 | 24,284.9 | 29,977.1 | 25,588.4 | 33,979.9 | 29,640.9 | 36,046.6 | 33,834.8 | 27,475.3 | 24,674.4 | 27,885.1 | 27,462.1 | 34,567.6 |
| 1997 | 28,849.6 | 33,175.3 | 30,160.8 | 29,409.3 | 28,449.3 | 24,832.7 | 27,044.6 | 27,267.7 | 28,356.0 | 29,459.2 | 28,159.0 | 31,416.2 |
| 1998 | 32,691.0 | 31,470.5 | 29,697.5 | 39,120.8 | 35,704.2 | 38,644.7 | 33,154.7 | 31,136.9 | 26,328.4 | 25,191.6 | 25,764.3 | 29,402.1 |
| 1999 | 22,726.5 | 25,388.9 | 30,915.0 | 40,216.9 | 34,938.2 | 29,805.1 | 24,011.0 | 22,359.4 | 25,317.2 | 27,459.5 | 29,778.3 | 31,972.5 |
| 2000 | 24,247.8 | 23,956.7 | 21,605.2 | 30,422.3 | 29,856.6 | 35,054.1 | 34,574.0 | 26,417.7 | 23,775.8 | 23,598.8 | 23,300.1 | 23,816.4 |
| 2001 | 22,356.5 | 22,964.4 | 24,203.6 | 24,785.3 | 27,950.9 | 27,391.2 | 29,929.1 | 31,453.4 | 28,639.8 | 26,284.6 | 22,855.0 | 30,763.0 |
| 2002 | 27,919.9 | 24,339.2 | 25,953.2 | 36,023.7 | 40,061.2 | 39,572.6 | 37,678.4 | 39,039.9 | 31,653.9 | 32,572.0 | 36,310.6 | 35,997.5 |
| 2003 | 29,051.5 | 26,229.6 | 24,892.6 | 31,979.9 | 34,101.3 | 39,592.0 | 37,136.0 | 39,651.0 | 39,363.1 | 39,115.6 | 38,590.2 | 37,395.6 |
| 2004 | 29,800.6 | 30,099.1 | 34,409.0 | 37,970.5 | 41,355.5 | 42,920.0 | 42,061.5 | 44,707.9 | 36,194.7 | 35,946.0 | 30,713.1 | 46,760.2 |
| 2005 | 37,688.7 | 40,147.9 | 34,126.3 | 43,775.0 | 39,839.2 | 42,476.5 | 37,471.9 | 38,100.2 | 34,682.2 | 31,568.1 | 38,193.8 | 40,911.4 |
| 2006 | 29,549.8 | 37,744.5 | 31,986.5 | 40,532.2 | 42,580.4 | 47,114.6 | 38,718.5 | 47,632.4 | 42,537.4 | 35,428.7 | 34,120.2 | 41,304.3 |
| 2007 | 35,768.0 | 38,254.3 | 39,088.9 | 41,921.7 | 50,606.0 | 48,017.6 | 43,954.7 | 45,792.8 | 50,387.1 | 46,050.3 | 46,211.3 | 52,856.4 |
| 2008 | 41,485.9 | 44,049.5 | 47,641.9 | 46,210.1 | 41,991.0 | 43,229.6 | 39,050.3 | 42,908.4 | 36,628.4 | 38,220.9 | 33,089.7 | 37,855.0 |
| 2009 | 34,497.0 | 31,820.4 | 28,733.4 | 32,230.9 | 35,161.8 | 48,082.2 | 39,300.2 | 41,228.7 | 39,160.5 | 38,454.1 | 37,285.3 | 45,939.0 |
| 2010 | 32,707.2 | 40,824.6 | 36,548.1 | 39,000.4 | 39,444.1 | 42,378.2 | 43,855.8 | 46,609.5 | 37,620.1 | 36,486.8 | 35,438.0 | 34,902.3 |
| 2011 | 31,318.5 | 33,012.3 | 26,281.8 | 24,309.7 | 28,968.0 | 26,882.5 | 24,006.4 | 28,589.4 | 30,058.6 | 22,377.4 | 27,666.6 | 34,287.7 |
| 2012 | 26,629.5 | 22,697.3 | 23,239.5 | 21,932.1 | 22,980.6 | 25,782.4 | 22,161.6 | 19,682.1 | 19,652.8 | 25,307.3 | 29,538.2 | 29,632.6 |
| 2013 | 26,045.1 | 23,556.4 | 21,969.6 | 24,893.2 | 21,757.8 | 18,893.9 | 19,571.1 | 17,967.5 | 20,265.8 | 18,599.8 | 21,527.6 | 19,115.7 |
| 2014 | 20,086.2 | 22,847.5 | 20,270.3 | 18,391.8 | 17,045.3 | 16,126.8 | 17,351.2 | 17,443.7 | 15,482.4 | 17,196.2 | 19,820.6 | 25,180.2 |
| 2015 | 18,778.1 | 20,743.6 | 19,203.1 | 19,567.1 | 18,258.3 | 16,470.1 | 15,629.9 | 17,500.9 | 21,148.6 | 16,063.7 | 18,881.7 | 21,211.1 |
| 2016 | 17,024.3 | 15,840.9 | 21,990.0 | 16,061.8 | 17,658.4 | 18,698.8 | 21,361.2 | 20,568.1 | 19,622.6 | 15,424.3 | 14,595.1 | 15,792.3 |
| 2017 | 14,276.4 | 14,432.2 | 11,413.2 | 17,285.6 | 13,980.0 | 12,091.5 | 10,695.9 | 14,566.1 | 17,012.7 | 14,680.9 | 17,286.3 | 16,643.7 |
| 2018 | 15,386.0 | 17,209.9 | 18,321.3 | 19,568.2 | 20,356.4 | 19,929.2 | 16,604.0 | 13,869.2 | 19,497.0 | 15,130.6 | 14,349.9 | 12,320.8 |
| 2019 | 16,839.6 | 14,821.0 | 13,436.7 | 13,736.0 | 12,455.3 | 9,326.0 | 8,905.2 | 9,935.6 | 10,339.4 | 11,011.9 | 11,391.0 | 13,295.4 |
| 2020 | W | W | W | 5,188.4 | 8,150.5 | 8,606.2 | W | W | W | W | 6,757.7 | W |
| 2021 | W | W | W | W | W | W | W | W | W | W | W | W |
| 2022 | W | W | W | |||||||||
| - = No Data Reported; -- = Not Applicable; NA = Not Available; W = Withheld to avoid disclosure of individual company data. |
| Release Date: 6/1/2022 |
| Next Release Date: TBD |