|
Download Data (XLS File) |
|
||||||||
|
||||||||
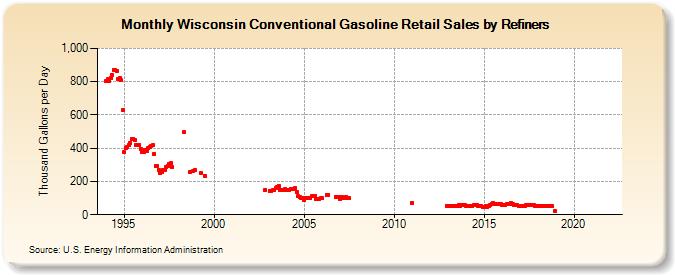
| Wisconsin Conventional Gasoline Retail Sales by Refiners (Thousand Gallons per Day) | ||||||||
| Year | Jan | Feb | Mar | Apr | May | Jun | Jul | Aug | Sep | Oct | Nov | Dec |
|---|---|---|---|---|---|---|---|---|---|---|---|---|
| 1994 | 802.0 | 813.9 | 804.3 | 820.6 | 842.8 | 871.6 | 868.5 | 861.7 | 816.0 | 820.7 | 807.6 | 629.3 |
| 1995 | 378.2 | 402.5 | 407.1 | 420.0 | 432.8 | 455.6 | 456.0 | 446.4 | 417.8 | 417.5 | 421.0 | 396.0 |
| 1996 | 379.3 | 376.2 | 388.5 | 384.6 | 403.0 | 409.2 | 412.1 | 418.9 | 367.1 | 291.4 | 290.7 | 270.7 |
| 1997 | 249.7 | 255.7 | 268.2 | 267.1 | 288.7 | 292.4 | 306.5 | 308.5 | 285.5 | W | W | W |
| 1998 | W | W | W | W | 495.5 | W | W | W | 255.2 | W | 261.0 | 266.9 |
| 1999 | W | W | W | 253.6 | W | W | 235.7 | W | W | W | W | W |
| 2000 | W | W | W | W | W | W | W | W | W | W | W | W |
| 2001 | W | W | W | W | W | W | W | W | W | W | W | W |
| 2002 | W | W | W | W | W | W | W | W | W | W | 147.9 | W |
| 2003 | W | 144.6 | 143.1 | 147.3 | 151.4 | 161.5 | 168.0 | 173.8 | 150.2 | 151.2 | 148.4 | 153.0 |
| 2004 | 148.9 | 149.2 | 149.2 | 157.3 | 156.6 | 156.3 | 158.6 | 134.1 | 110.5 | 106.8 | 101.2 | 101.3 |
| 2005 | 90.9 | 99.0 | 103.2 | 99.9 | 99.5 | 110.4 | 111.7 | 113.7 | 94.4 | 97.2 | 96.9 | 101.4 |
| 2006 | 97.6 | W | W | 118.5 | 120.2 | W | W | W | W | 108.4 | W | 109.1 |
| 2007 | 92.5 | 104.9 | 99.7 | 102.7 | 108.1 | 102.2 | 98.3 | W | W | W | W | W |
| 2008 | W | W | W | W | W | W | W | W | W | W | W | W |
| 2009 | W | W | W | W | W | W | W | W | W | W | W | W |
| 2010 | W | W | W | W | W | W | W | W | W | W | W | W |
| 2011 | 72.2 | W | W | W | W | W | W | W | W | W | W | W |
| 2012 | W | W | W | W | W | W | W | W | W | W | W | 54.7 |
| 2013 | 52.8 | 54.8 | 52.7 | 50.5 | 51.4 | 51.1 | 55.4 | 56.0 | 53.9 | 56.1 | 56.5 | 56.6 |
| 2014 | 52.4 | 54.3 | 51.2 | 51.9 | 55.2 | 57.0 | 56.9 | 56.6 | 52.9 | 52.3 | 51.6 | 48.1 |
| 2015 | 46.0 | 50.0 | 47.8 | 49.8 | 59.7 | 64.6 | 67.5 | 64.7 | 63.1 | 65.2 | 65.3 | 64.2 |
| 2016 | 60.6 | 59.5 | 59.1 | 62.7 | 64.4 | 66.6 | 72.2 | 64.1 | 60.1 | 56.8 | 56.1 | 55.2 |
| 2017 | 49.5 | 51.6 | 52.7 | 53.8 | 56.9 | 60.9 | 60.6 | 58.7 | 57.2 | 57.5 | 55.4 | 55.0 |
| 2018 | 49.8 | 51.8 | 51.4 | 53.2 | 54.7 | 55.3 | 54.7 | 54.5 | 51.1 | 51.3 | W | 22.1 |
| 2019 | W | W | W | W | W | W | W | W | W | W | W | W |
| 2020 | W | W | W | W | W | W | W | W | W | W | W | W |
| 2021 | W | W | W | W | W | W | W | W | W | W | - | - |
| 2022 | - | - | - | |||||||||
| - = No Data Reported; -- = Not Applicable; NA = Not Available; W = Withheld to avoid disclosure of individual company data. |
| Release Date: 6/1/2022 |
| Next Release Date: TBD |