|
Download Data (XLS File) |
|
||||||||
|
||||||||
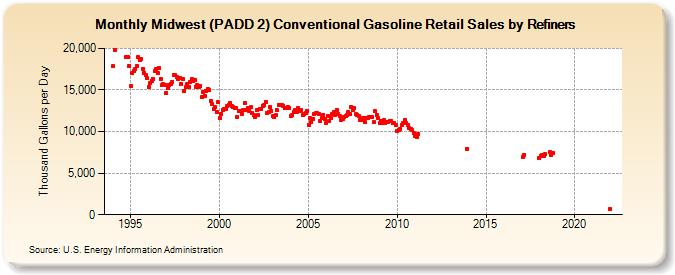
| Midwest (PADD 2) Conventional Gasoline Retail Sales by Refiners (Thousand Gallons per Day) | ||||||||
| Year | Jan | Feb | Mar | Apr | May | Jun | Jul | Aug | Sep | Oct | Nov | Dec |
|---|---|---|---|---|---|---|---|---|---|---|---|---|
| 1994 | 17,836.0 | 19,827.7 | W | W | W | W | W | W | W | 19,001.1 | 18,928.4 | 17,864.7 |
| 1995 | 15,500.0 | 17,014.5 | 17,298.3 | 17,503.2 | 17,894.2 | 18,936.4 | 18,607.7 | 18,667.5 | 17,565.2 | 17,074.8 | 16,756.2 | 16,398.1 |
| 1996 | 15,332.9 | 15,811.3 | 16,093.7 | 16,361.6 | 17,237.8 | 17,542.8 | 17,010.2 | 17,594.9 | 16,339.4 | 15,608.8 | 15,669.8 | 15,625.4 |
| 1997 | 14,616.0 | 15,294.9 | 15,644.8 | 15,727.9 | 16,017.9 | 16,745.1 | 16,762.9 | 16,537.6 | 16,269.8 | 16,423.3 | 15,761.0 | 16,333.1 |
| 1998 | 14,847.7 | 15,351.8 | 15,672.9 | 15,392.5 | 15,995.3 | 16,339.5 | 16,134.8 | 16,199.0 | 15,333.7 | 15,591.4 | 15,404.2 | 15,457.4 |
| 1999 | 14,146.0 | 14,784.1 | 14,322.1 | 14,917.5 | 15,105.8 | 15,050.1 | 13,660.4 | 13,303.2 | 12,680.3 | 12,975.7 | 12,358.1 | 13,527.5 |
| 2000 | 11,586.8 | 12,149.2 | 12,600.3 | 12,656.4 | 12,738.2 | 13,034.0 | 13,248.0 | 13,382.2 | 13,030.0 | 12,931.5 | 12,796.5 | 12,806.8 |
| 2001 | 11,721.5 | 12,489.6 | 12,476.3 | 12,105.7 | 12,531.8 | 13,472.9 | 12,636.7 | 12,814.0 | 12,456.0 | 12,909.2 | 12,205.1 | 11,989.2 |
| 2002 | 11,776.0 | 12,544.9 | 11,982.0 | 12,748.5 | 12,721.6 | 13,116.7 | 13,171.5 | 13,596.3 | 12,289.1 | 12,332.9 | 12,908.5 | 12,433.1 |
| 2003 | 11,859.6 | 11,773.8 | 11,966.9 | 12,531.9 | 13,249.1 | 13,220.9 | 13,167.9 | 13,109.7 | 12,829.2 | 12,873.1 | 12,950.9 | 12,827.1 |
| 2004 | 11,845.6 | 11,991.0 | 12,366.3 | 12,564.0 | 12,340.5 | 12,857.0 | 12,474.5 | 12,554.9 | 12,045.2 | 12,085.4 | 12,206.6 | 12,456.9 |
| 2005 | 10,786.7 | 11,593.9 | 11,125.1 | 11,559.9 | 12,142.7 | 12,200.3 | 12,224.3 | 12,064.1 | 11,301.6 | 11,639.5 | 12,024.7 | 11,516.7 |
| 2006 | 11,066.8 | 11,882.1 | 11,327.3 | 11,597.0 | 12,064.4 | 12,324.8 | 12,023.3 | 12,637.8 | 12,147.3 | 11,924.4 | 11,410.8 | 11,525.7 |
| 2007 | 11,709.7 | 11,834.1 | 11,953.0 | 12,352.8 | 12,092.5 | 13,006.7 | 12,537.0 | 12,828.3 | 12,073.1 | 12,002.5 | 11,916.0 | 11,360.1 |
| 2008 | 11,347.3 | 11,605.1 | 11,151.4 | 11,614.4 | 11,572.9 | 11,719.3 | 11,730.3 | 11,777.1 | 11,112.9 | 12,432.9 | 11,994.9 | 11,636.0 |
| 2009 | 10,989.7 | 11,254.9 | 11,037.7 | 11,358.8 | 11,078.5 | 11,174.2 | 11,188.0 | 11,293.9 | 11,212.7 | 10,987.9 | 11,006.7 | 10,834.1 |
| 2010 | 10,122.8 | 10,221.2 | 10,364.8 | 10,831.0 | 11,049.1 | 11,337.9 | 11,035.1 | 10,836.8 | 10,415.8 | 10,319.8 | 10,139.3 | 9,872.6 |
| 2011 | 9,516.6 | 9,365.5 | 9,711.1 | W | W | W | W | W | W | W | W | W |
| 2012 | W | W | W | W | W | W | W | W | W | W | W | W |
| 2013 | W | W | W | W | W | W | W | W | W | W | W | 7,943.8 |
| 2014 | W | W | W | W | W | W | W | W | W | W | W | W |
| 2015 | W | W | W | W | W | W | W | W | W | W | W | W |
| 2016 | W | W | W | W | W | W | W | W | W | W | W | W |
| 2017 | W | 6,991.8 | 7,211.7 | W | W | W | W | W | W | W | W | W |
| 2018 | 6,874.5 | 7,114.6 | 7,194.1 | 7,076.6 | 7,296.7 | W | W | 7,513.5 | 7,173.1 | 7,438.1 | W | W |
| 2019 | W | W | W | W | W | W | W | W | W | W | W | W |
| 2020 | W | W | W | W | W | W | W | W | W | W | W | W |
| 2021 | W | W | W | W | W | W | W | W | W | W | W | W |
| 2022 | 683.4 | W | W | |||||||||
| - = No Data Reported; -- = Not Applicable; NA = Not Available; W = Withheld to avoid disclosure of individual company data. |
| Release Date: 6/1/2022 |
| Next Release Date: TBD |