|
Download Data (XLS File) |
|
||||||||
|
||||||||
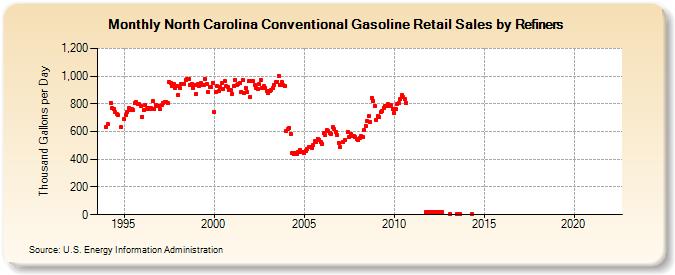
| North Carolina Conventional Gasoline Retail Sales by Refiners (Thousand Gallons per Day) | ||||||||
| Year | Jan | Feb | Mar | Apr | May | Jun | Jul | Aug | Sep | Oct | Nov | Dec |
|---|---|---|---|---|---|---|---|---|---|---|---|---|
| 1994 | 633.1 | 651.8 | W | 804.8 | 768.5 | 763.4 | 739.7 | 729.0 | 717.9 | W | 629.8 | W |
| 1995 | 687.4 | 720.5 | 741.4 | 766.6 | 754.5 | 763.3 | 754.7 | 807.5 | 813.2 | 800.9 | 798.5 | 783.8 |
| 1996 | 708.4 | 753.7 | 788.9 | 764.0 | 767.1 | 764.8 | 768.1 | 819.3 | 763.6 | 790.8 | 781.7 | 786.9 |
| 1997 | 759.2 | 793.0 | 806.6 | 816.6 | 815.6 | 805.6 | 960.9 | 953.4 | 926.3 | 946.4 | 915.5 | 928.2 |
| 1998 | 866.0 | 911.2 | 944.3 | 940.2 | 946.2 | 973.8 | 982.7 | 976.1 | 937.9 | 943.3 | 914.7 | 933.1 |
| 1999 | 873.4 | 940.5 | 930.6 | 948.9 | 933.0 | 937.5 | 980.0 | 946.2 | 886.5 | 924.2 | 919.2 | 952.7 |
| 2000 | 743.4 | 887.4 | 926.3 | 890.8 | 924.6 | 950.1 | 907.5 | 963.8 | 927.1 | 919.8 | 901.6 | 896.2 |
| 2001 | 871.5 | 928.3 | 971.1 | 935.5 | 943.8 | 950.5 | 885.0 | 973.1 | 874.9 | 913.7 | 883.8 | 962.9 |
| 2002 | 852.2 | 966.0 | 964.7 | 936.8 | 911.6 | 910.1 | 940.1 | 972.2 | 917.1 | 925.4 | 914.8 | 895.8 |
| 2003 | 875.7 | 889.0 | 897.3 | 914.4 | 938.1 | 954.2 | 959.4 | 1,001.5 | 933.5 | 958.5 | 939.0 | 926.4 |
| 2004 | 606.0 | 617.1 | 627.7 | 583.3 | 443.0 | 436.5 | 448.5 | 440.4 | 451.8 | 465.4 | 448.9 | 449.0 |
| 2005 | 445.7 | 460.1 | 476.8 | 485.3 | 489.4 | 484.3 | 499.9 | 529.7 | 523.2 | 548.6 | 541.8 | 522.1 |
| 2006 | 509.5 | 586.0 | 572.1 | 610.8 | 604.0 | 592.8 | 585.9 | 631.2 | 616.9 | 599.2 | 573.0 | 517.5 |
| 2007 | 486.7 | NA | 526.7 | 538.8 | NA | 595.6 | 557.3 | 583.9 | 566.5 | 567.2 | 563.3 | 546.6 |
| 2008 | 535.9 | 556.1 | 566.8 | 562.6 | 611.4 | 639.9 | 677.5 | 709.4 | 667.7 | 844.1 | 820.8 | 784.2 |
| 2009 | 685.5 | 715.5 | 705.9 | 737.7 | 751.4 | 770.8 | 786.1 | 787.1 | 798.1 | 787.4 | 792.4 | 761.4 |
| 2010 | 731.9 | 761.5 | 797.8 | 802.9 | 836.4 | 863.5 | 848.4 | 835.8 | 806.1 | W | W | W |
| 2011 | W | W | W | W | W | W | W | W | W | 16.2 | 16.3 | 18.2 |
| 2012 | 16.5 | 21.3 | 22.0 | 22.3 | 22.3 | 21.3 | 18.8 | W | 17.0 | W | W | W |
| 2013 | W | 4.9 | W | W | W | W | 8.0 | W | 2.3 | W | W | W |
| 2014 | W | W | W | W | 2.4 | W | W | W | W | W | W | W |
| 2015 | W | W | W | W | W | W | W | W | W | W | W | W |
| 2016 | W | W | W | W | W | W | W | W | W | W | W | W |
| 2017 | W | W | W | W | W | W | W | W | W | W | W | W |
| 2018 | W | W | W | W | W | W | W | W | W | W | W | W |
| 2019 | W | W | W | W | W | W | W | W | W | W | W | W |
| 2020 | W | W | W | W | W | W | W | W | W | W | W | W |
| 2021 | W | W | W | W | W | - | - | - | - | - | W | W |
| 2022 | W | W | W | |||||||||
| - = No Data Reported; -- = Not Applicable; NA = Not Available; W = Withheld to avoid disclosure of individual company data. |
| Release Date: 6/1/2022 |
| Next Release Date: TBD |