|
Download Data (XLS File) |
|
||||||||
|
||||||||
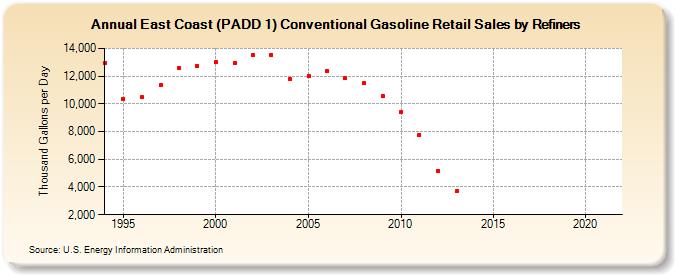
| East Coast (PADD 1) Conventional Gasoline Retail Sales by Refiners (Thousand Gallons per Day) | ||||||||
| Decade | Year-0 | Year-1 | Year-2 | Year-3 | Year-4 | Year-5 | Year-6 | Year-7 | Year-8 | Year-9 |
|---|---|---|---|---|---|---|---|---|---|---|
| 1990's | 12,934.2 | 10,358.2 | 10,474.5 | 11,336.4 | 12,616.8 | 12,722.7 | ||||
| 2000's | 12,998.3 | 12,934.3 | 13,492.6 | 13,554.9 | 11,770.0 | 12,017.8 | 12,376.9 | 11,833.0 | 11,488.6 | 10,553.5 |
| 2010's | 9,423.6 | 7,778.2 | 5,183.5 | 3,684.8 | W | W | W | W | W | W |
| 2020's | W |
| - = No Data Reported; -- = Not Applicable; NA = Not Available; W = Withheld to avoid disclosure of individual company data. |
| Release Date: 6/1/2022 |
| Next Release Date: TBD |