|
Download Data (XLS File) |
|
||||||||
|
||||||||
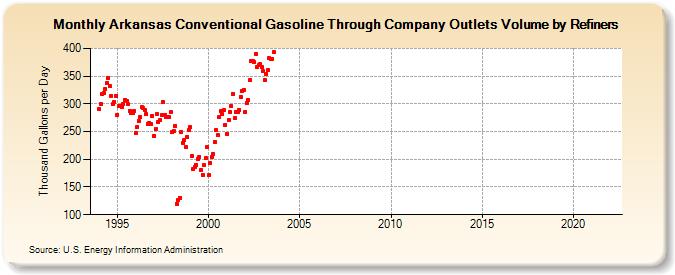
| Arkansas Conventional Gasoline Through Company Outlets Volume by Refiners (Thousand Gallons per Day) | ||||||||
| Year | Jan | Feb | Mar | Apr | May | Jun | Jul | Aug | Sep | Oct | Nov | Dec |
|---|---|---|---|---|---|---|---|---|---|---|---|---|
| 1994 | 290.7 | 300.1 | 317.2 | 319.2 | 327.3 | 337.6 | 347.0 | 331.4 | 314.4 | 299.1 | 302.9 | 314.6 |
| 1995 | 280.7 | 295.3 | 295.3 | 294.3 | 300.0 | 307.2 | 305.5 | 299.2 | 286.8 | 283.2 | 282.7 | 287.2 |
| 1996 | 247.9 | 258.1 | 269.9 | 276.1 | 293.8 | 292.2 | 289.1 | 281.0 | 264.3 | 266.1 | 263.5 | 278.8 |
| 1997 | 242.5 | 254.4 | 281.1 | 267.1 | 270.9 | 279.0 | 302.7 | 280.6 | 276.4 | 276.1 | 275.7 | 284.9 |
| 1998 | 250.0 | 250.4 | 260.7 | 119.6 | 125.7 | 130.8 | 249.2 | 229.3 | 234.0 | 222.2 | 240.2 | 253.3 |
| 1999 | 257.6 | 205.9 | 183.2 | 186.9 | 190.0 | 200.0 | 204.7 | 180.5 | 172.4 | 188.8 | 202.3 | 221.6 |
| 2000 | 170.8 | 193.3 | 204.4 | 210.2 | 231.7 | 252.7 | 244.0 | 276.4 | 286.4 | 281.5 | 288.3 | 261.4 |
| 2001 | 245.9 | 270.6 | 285.4 | 295.9 | 318.3 | 275.2 | 285.3 | 285.6 | 289.5 | 312.9 | 323.6 | 325.1 |
| 2002 | 285.4 | 301.9 | 307.8 | 342.4 | 376.5 | 378.0 | 375.2 | 390.4 | 366.3 | 370.3 | 371.8 | 365.9 |
| 2003 | 358.9 | 343.8 | 354.5 | 361.5 | 382.3 | 380.2 | 381.3 | 393.3 | W | W | W | W |
| 2004 | W | W | W | W | W | W | W | W | W | W | W | W |
| 2005 | W | W | W | W | W | W | W | W | W | W | W | W |
| 2006 | W | W | W | W | W | W | W | W | W | W | W | W |
| 2007 | W | W | W | W | W | W | W | W | W | W | W | W |
| 2008 | W | W | W | W | W | W | W | W | W | W | W | W |
| 2009 | W | W | W | W | W | W | W | W | W | W | W | W |
| 2010 | W | W | W | W | W | W | W | W | W | W | W | W |
| 2011 | W | W | W | W | W | W | W | W | W | - | - | - |
| 2012 | - | - | - | - | - | - | - | - | - | - | - | - |
| 2013 | - | - | - | - | - | - | - | - | - | - | - | - |
| 2014 | - | - | W | W | W | W | W | W | W | W | W | W |
| 2015 | W | W | W | W | W | W | W | W | W | W | W | W |
| 2016 | W | W | W | W | W | W | W | W | W | W | W | - |
| 2017 | - | - | - | - | - | - | - | - | - | - | - | - |
| 2018 | - | - | - | - | - | - | - | - | - | - | - | - |
| 2019 | - | - | - | - | - | - | - | - | - | - | - | - |
| 2020 | - | - | - | - | - | - | - | - | - | - | - | - |
| 2021 | - | - | - | - | - | - | - | - | - | - | - | - |
| 2022 | - | - | - | |||||||||
| - = No Data Reported; -- = Not Applicable; NA = Not Available; W = Withheld to avoid disclosure of individual company data. |
| Release Date: 6/1/2022 |
| Next Release Date: TBD |