|
Download Data (XLS File) |
|
||||||||
|
||||||||
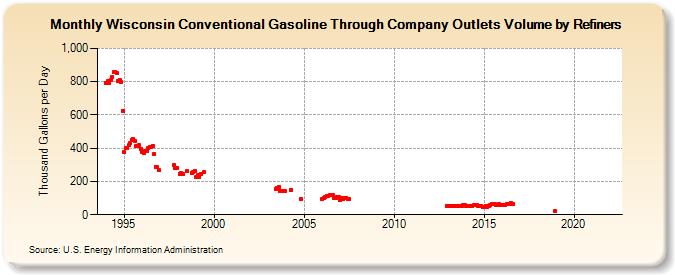
| Wisconsin Conventional Gasoline Through Company Outlets Volume by Refiners (Thousand Gallons per Day) | ||||||||
| Year | Jan | Feb | Mar | Apr | May | Jun | Jul | Aug | Sep | Oct | Nov | Dec |
|---|---|---|---|---|---|---|---|---|---|---|---|---|
| 1994 | 792.3 | 801.1 | 791.2 | 809.1 | 830.2 | 857.6 | 857.1 | 851.1 | 806.3 | 810.1 | 798.6 | 626.3 |
| 1995 | 375.6 | 399.4 | 401.7 | 417.5 | 430.4 | 452.2 | 455.3 | 443.0 | 414.9 | 414.1 | 417.5 | 393.4 |
| 1996 | 376.0 | 373.9 | 385.4 | 382.2 | 400.3 | 406.9 | 408.5 | 416.1 | 365.0 | 288.7 | 287.7 | 268.3 |
| 1997 | W | W | W | W | W | W | W | W | W | 298.3 | 282.8 | 280.8 |
| 1998 | W | 246.4 | 251.1 | 247.3 | W | W | 262.3 | W | W | 251.8 | 254.5 | 260.1 |
| 1999 | 224.8 | 237.2 | 229.2 | 243.6 | W | 253.9 | W | W | W | W | W | W |
| 2000 | W | W | W | W | W | W | W | W | W | W | W | W |
| 2001 | W | W | W | W | W | W | W | W | W | W | W | W |
| 2002 | W | W | W | W | W | W | W | W | W | W | W | W |
| 2003 | W | W | W | W | W | 154.2 | 162.4 | 166.8 | 142.6 | 142.9 | 141.5 | 143.7 |
| 2004 | W | W | W | 150.4 | W | W | W | W | W | W | 97.0 | W |
| 2005 | W | W | W | W | W | W | W | W | W | W | W | W |
| 2006 | 95.2 | 99.9 | 103.5 | 113.1 | 113.9 | 117.6 | W | 116.8 | 99.4 | 102.9 | 105.4 | 104.8 |
| 2007 | 90.9 | 99.4 | 93.7 | 97.9 | 103.0 | 96.4 | 94.4 | W | W | W | W | W |
| 2008 | W | W | W | W | W | W | W | W | W | W | W | W |
| 2009 | W | W | W | W | W | W | W | W | W | W | W | W |
| 2010 | W | W | W | W | W | W | W | W | W | W | W | W |
| 2011 | W | W | W | W | W | W | W | W | W | W | W | W |
| 2012 | W | W | W | W | W | W | W | W | W | W | W | 54.0 |
| 2013 | 52.2 | 53.7 | 52.0 | 49.7 | 49.9 | 50.2 | 54.0 | 54.8 | 53.0 | 55.1 | 55.5 | 55.5 |
| 2014 | 51.6 | 53.3 | 50.6 | 51.0 | 54.2 | 56.0 | 56.0 | 55.8 | 52.2 | 51.5 | 51.0 | 47.3 |
| 2015 | 45.3 | 49.7 | 47.2 | 49.5 | 58.3 | 63.4 | 65.2 | 61.5 | 58.7 | 61.3 | 61.8 | 60.6 |
| 2016 | 56.8 | 57.4 | 58.4 | 61.9 | 63.4 | 65.5 | 71.2 | 63.1 | W | W | W | W |
| 2017 | W | W | W | W | W | W | W | W | W | W | W | W |
| 2018 | W | W | W | W | W | W | W | W | W | W | W | 21.5 |
| 2019 | W | W | W | W | W | W | W | W | W | W | W | W |
| 2020 | W | W | W | W | W | W | W | W | W | W | W | W |
| 2021 | W | W | W | W | W | - | - | - | - | - | - | - |
| 2022 | - | - | - | |||||||||
| - = No Data Reported; -- = Not Applicable; NA = Not Available; W = Withheld to avoid disclosure of individual company data. |
| Release Date: 6/1/2022 |
| Next Release Date: TBD |