|
Download Data (XLS File) |
|
||||||||
|
||||||||
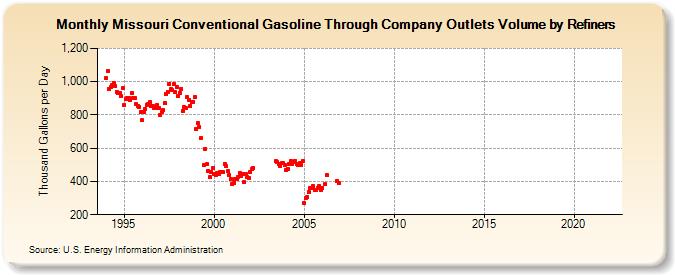
| Missouri Conventional Gasoline Through Company Outlets Volume by Refiners (Thousand Gallons per Day) | ||||||||
| Year | Jan | Feb | Mar | Apr | May | Jun | Jul | Aug | Sep | Oct | Nov | Dec |
|---|---|---|---|---|---|---|---|---|---|---|---|---|
| 1994 | 1,020.9 | 1,064.1 | 956.1 | 966.2 | 979.1 | 994.8 | 974.8 | 939.1 | 930.3 | 931.7 | 913.6 | 959.2 |
| 1995 | 857.9 | 896.9 | 898.9 | 900.3 | 887.8 | 931.7 | 903.9 | 899.1 | 863.1 | 856.1 | 849.1 | 816.9 |
| 1996 | 766.5 | 815.8 | 835.9 | 862.3 | 868.6 | 877.2 | 854.3 | 853.5 | 841.8 | 840.2 | 857.4 | 843.5 |
| 1997 | 799.3 | 818.7 | 829.9 | 870.5 | 927.4 | 940.7 | 986.2 | 954.8 | 948.7 | 985.9 | 935.2 | 969.5 |
| 1998 | 913.3 | 933.4 | 958.3 | 825.7 | 848.6 | 840.8 | 904.9 | 890.9 | 853.7 | 876.6 | 878.3 | 905.3 |
| 1999 | 715.9 | 751.3 | 728.7 | 659.8 | W | 499.6 | 597.6 | 502.3 | 463.0 | 425.9 | 457.3 | 481.2 |
| 2000 | 446.4 | 441.5 | 450.1 | 446.0 | 456.5 | 454.1 | 456.1 | 506.2 | 492.4 | 461.3 | 437.3 | 416.0 |
| 2001 | 382.5 | 390.8 | 411.9 | 414.5 | 427.7 | 451.9 | 432.2 | 446.5 | 394.5 | 444.5 | 429.3 | 422.2 |
| 2002 | 455.4 | 476.3 | 481.0 | W | W | W | W | W | W | W | W | W |
| 2003 | W | W | W | W | W | 520.8 | 515.3 | 506.6 | 495.2 | 510.4 | 510.9 | 498.7 |
| 2004 | 469.6 | 472.1 | 504.2 | 523.3 | 506.0 | 514.4 | 523.0 | 505.0 | 501.1 | 508.6 | 499.3 | 523.5 |
| 2005 | 268.3 | 298.6 | 307.0 | 335.8 | 359.2 | 362.2 | 371.0 | 350.4 | 350.5 | 362.3 | 372.3 | 348.8 |
| 2006 | 362.3 | W | 382.5 | 437.6 | W | W | W | W | W | W | 404.9 | 392.3 |
| 2007 | W | W | W | W | W | W | W | W | W | W | W | W |
| 2008 | W | W | W | W | W | W | W | W | W | W | W | W |
| 2009 | W | W | W | W | W | W | W | W | W | W | W | W |
| 2010 | W | W | W | W | W | W | W | W | W | W | W | W |
| 2011 | W | W | W | W | W | W | W | W | W | - | - | - |
| 2012 | - | - | - | - | - | - | - | - | - | - | - | - |
| 2013 | - | - | - | - | - | - | - | - | - | - | - | - |
| 2014 | - | - | - | - | - | - | - | - | - | - | - | - |
| 2015 | - | - | - | - | - | - | - | - | - | - | - | - |
| 2016 | - | - | - | - | - | - | - | - | - | - | - | - |
| 2017 | - | - | - | - | - | - | - | - | - | - | - | - |
| 2018 | - | - | - | - | - | - | - | - | - | - | - | - |
| 2019 | - | - | - | - | - | - | - | - | - | - | - | - |
| 2020 | - | - | - | - | - | - | - | - | - | - | - | - |
| 2021 | - | - | - | - | - | - | - | - | - | - | - | - |
| 2022 | - | - | - | |||||||||
| - = No Data Reported; -- = Not Applicable; NA = Not Available; W = Withheld to avoid disclosure of individual company data. |
| Release Date: 6/1/2022 |
| Next Release Date: TBD |