|
Download Data (XLS File) |
|
||||||||
|
||||||||
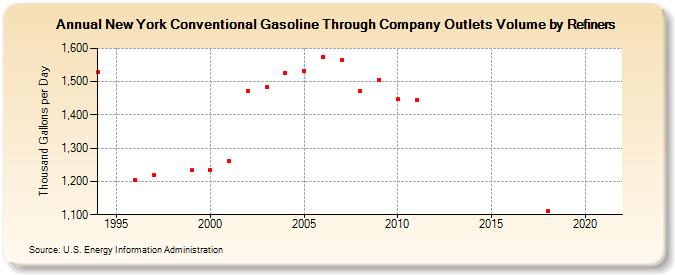
| New York Conventional Gasoline Through Company Outlets Volume by Refiners (Thousand Gallons per Day) | ||||||||
| Decade | Year-0 | Year-1 | Year-2 | Year-3 | Year-4 | Year-5 | Year-6 | Year-7 | Year-8 | Year-9 |
|---|---|---|---|---|---|---|---|---|---|---|
| 1990's | 1,527.7 | W | 1,203.5 | 1,218.5 | W | 1,233.3 | ||||
| 2000's | 1,234.7 | 1,260.3 | 1,473.4 | 1,482.5 | 1,526.1 | 1,531.1 | 1,574.8 | 1,566.0 | 1,471.0 | 1,506.3 |
| 2010's | 1,446.8 | 1,445.5 | W | W | W | W | W | W | 1,111.9 | W |
| 2020's | W |
| - = No Data Reported; -- = Not Applicable; NA = Not Available; W = Withheld to avoid disclosure of individual company data. |
| Release Date: 6/1/2022 |
| Next Release Date: TBD |