|
Download Data (XLS File) |
|
||||||||
|
||||||||
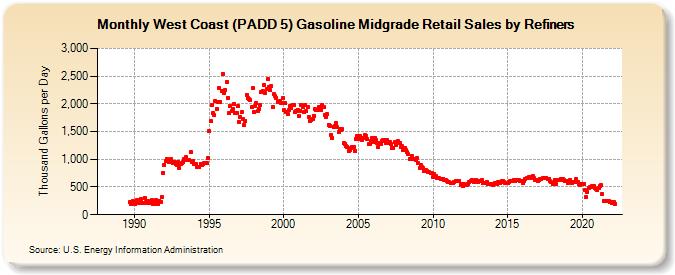
| West Coast (PADD 5) Gasoline Midgrade Retail Sales by Refiners (Thousand Gallons per Day) | ||||||||
| Year | Jan | Feb | Mar | Apr | May | Jun | Jul | Aug | Sep | Oct | Nov | Dec |
|---|---|---|---|---|---|---|---|---|---|---|---|---|
| 1988 | NA | NA | NA | NA | NA | NA | NA | NA | NA | NA | NA | NA |
| 1989 | W | W | W | W | W | W | W | W | 222.9 | 195.0 | 203.7 | 242.4 |
| 1990 | 188.6 | 218.2 | 262.1 | 210.0 | 209.2 | 277.1 | 207.8 | 214.0 | 302.0 | 228.1 | 215.6 | 255.9 |
| 1991 | 202.5 | 217.5 | 264.2 | 200.5 | 198.5 | 260.5 | 201.1 | 201.9 | 256.1 | 233.5 | 322.8 | 756.9 |
| 1992 | 902.2 | 972.9 | 1,004.4 | 966.6 | 951.7 | 1,002.6 | 948.5 | 930.9 | 957.1 | 911.8 | 902.9 | 957.5 |
| 1993 | 841.0 | 912.8 | 934.1 | 949.5 | 1,005.5 | 1,032.8 | 993.4 | 994.9 | 989.1 | 1,126.5 | 947.5 | 977.4 |
| 1994 | 911.6 | 913.4 | 864.0 | 866.4 | 857.5 | 921.2 | 892.6 | 917.1 | 927.4 | 931.6 | 932.6 | 1,020.2 |
| 1995 | 1,503.4 | 1,683.3 | 1,981.5 | 1,842.2 | 1,801.3 | 2,055.4 | 1,910.1 | 2,037.3 | 2,284.1 | 2,029.2 | 2,230.0 | 2,545.0 |
| 1996 | 2,197.2 | 2,246.6 | 2,398.0 | 2,103.5 | 1,834.3 | 1,963.8 | 1,863.0 | 1,904.0 | 2,000.4 | 1,841.5 | 1,843.3 | 1,953.3 |
| 1997 | 1,673.3 | 1,769.2 | 1,847.9 | 1,731.9 | 1,625.8 | 1,699.0 | 2,164.4 | 2,100.6 | 2,087.1 | 2,075.6 | 1,934.1 | 2,279.5 |
| 1998 | 1,851.6 | 1,957.1 | 2,010.9 | 1,872.5 | 1,915.4 | 1,973.4 | 2,221.3 | 2,237.9 | 2,341.6 | 2,200.3 | 2,267.3 | 2,445.6 |
| 1999 | 2,304.6 | 2,245.1 | 2,319.3 | 1,935.0 | 2,171.1 | 2,142.3 | 2,103.0 | 2,040.2 | 2,031.1 | 2,051.3 | 2,020.5 | 2,109.0 |
| 2000 | 1,884.1 | 2,016.2 | 1,852.9 | 1,812.2 | 1,887.5 | 1,965.5 | 1,918.6 | 1,980.8 | 1,974.4 | 1,851.6 | 1,875.3 | 1,889.5 |
| 2001 | 1,781.1 | 1,875.5 | 1,975.3 | 1,942.8 | 1,850.3 | 1,974.5 | 1,865.2 | 1,948.0 | 1,760.3 | 1,688.8 | 1,705.1 | 1,730.3 |
| 2002 | 1,783.0 | 1,900.9 | 1,881.9 | 1,886.6 | 1,936.0 | 1,933.5 | 1,897.1 | 1,979.9 | 1,945.4 | 1,805.0 | 1,771.1 | 1,808.6 |
| 2003 | 1,618.6 | 1,608.7 | 1,438.6 | 1,386.9 | 1,590.9 | 1,603.4 | 1,652.2 | 1,575.0 | 1,496.5 | 1,554.1 | 1,528.5 | 1,539.6 |
| 2004 | 1,284.8 | 1,282.3 | 1,241.5 | 1,224.5 | 1,149.1 | 1,165.0 | 1,211.0 | 1,216.3 | 1,222.9 | 1,151.0 | 1,372.4 | 1,414.2 |
| 2005 | 1,366.8 | 1,418.1 | 1,382.8 | 1,349.1 | 1,388.7 | 1,439.5 | 1,428.1 | 1,373.1 | 1,271.7 | 1,273.2 | 1,326.0 | 1,388.3 |
| 2006 | 1,311.9 | 1,392.5 | 1,349.4 | 1,287.1 | 1,213.6 | 1,296.2 | 1,282.6 | 1,328.3 | 1,350.7 | 1,343.4 | 1,301.5 | 1,347.5 |
| 2007 | 1,289.8 | 1,305.3 | 1,270.3 | 1,211.8 | 1,208.6 | 1,307.0 | 1,264.4 | 1,308.0 | 1,322.0 | 1,295.2 | 1,214.0 | 1,232.5 |
| 2008 | 1,163.4 | 1,209.9 | 1,165.3 | 1,122.7 | 1,088.6 | 1,010.7 | 1,012.2 | 1,062.3 | 1,011.4 | 1,001.1 | 992.8 | 1,018.9 |
| 2009 | 928.3 | 838.2 | 901.5 | 858.0 | 843.9 | 788.9 | 807.1 | 789.3 | 778.8 | 769.0 | 747.3 | 751.0 |
| 2010 | 677.4 | 736.0 | 699.2 | 664.9 | 665.4 | 655.9 | 643.5 | 645.2 | 651.9 | 624.2 | 617.9 | 604.1 |
| 2011 | 581.8 | 596.2 | 568.4 | 563.5 | 567.1 | 590.5 | 606.0 | 605.1 | 608.9 | 607.2 | 544.8 | 545.1 |
| 2012 | 517.9 | 547.7 | 532.0 | 543.3 | 560.0 | 590.5 | 610.6 | 623.8 | 616.0 | 589.7 | 631.8 | 615.1 |
| 2013 | 588.3 | 599.9 | 615.7 | 627.2 | 571.3 | 568.9 | 564.1 | 594.4 | 554.3 | 561.1 | 561.1 | 561.3 |
| 2014 | 543.3 | 558.1 | 567.8 | 558.1 | 585.2 | 585.5 | 578.4 | 601.5 | 601.9 | 588.0 | 570.4 | 580.6 |
| 2015 | 567.6 | 592.9 | 600.1 | 602.6 | 611.9 | 631.3 | 612.2 | 622.5 | 622.7 | 619.4 | 599.4 | 600.7 |
| 2016 | 573.2 | 610.3 | 635.4 | 653.3 | 658.8 | 680.8 | 668.1 | 682.0 | 696.4 | 653.5 | 632.9 | 631.6 |
| 2017 | 605.9 | 619.5 | 646.9 | 640.8 | 658.4 | 663.6 | 659.7 | 665.5 | 645.9 | 652.0 | 601.2 | 584.2 |
| 2018 | 553.1 | 580.2 | 626.5 | 555.4 | 622.1 | 625.2 | 632.5 | 651.8 | 637.7 | 619.7 | 609.7 | 611.8 |
| 2019 | 569.2 | 599.8 | 619.3 | 594.6 | 576.7 | 599.0 | 595.3 | 647.0 | 596.5 | 556.4 | 539.9 | 552.4 |
| 2020 | 553.4 | 557.5 | 441.8 | 310.6 | 405.6 | 482.8 | 497.2 | 508.7 | 514.6 | 518.4 | 473.1 | 467.9 |
| 2021 | 445.1 | 481.1 | 512.3 | 531.5 | 375.1 | 253.8 | 252.6 | 251.3 | 248.1 | 242.0 | 236.1 | 227.0 |
| 2022 | 207.7 | 224.8 | 201.1 | |||||||||
| - = No Data Reported; -- = Not Applicable; NA = Not Available; W = Withheld to avoid disclosure of individual company data. |
| Release Date: 6/1/2022 |
| Next Release Date: TBD |