|
Download Data (XLS File) |
|
||||||||
|
||||||||
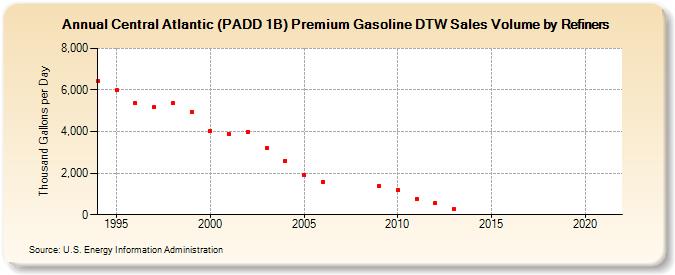
| Central Atlantic (PADD 1B) Premium Gasoline DTW Sales Volume by Refiners (Thousand Gallons per Day) | ||||||||
| Decade | Year-0 | Year-1 | Year-2 | Year-3 | Year-4 | Year-5 | Year-6 | Year-7 | Year-8 | Year-9 |
|---|---|---|---|---|---|---|---|---|---|---|
| 1990's | 6,417.9 | 5,981.6 | 5,364.4 | 5,168.8 | 5,350.6 | 4,954.7 | ||||
| 2000's | 4,036.2 | 3,858.6 | 3,994.8 | 3,231.2 | 2,604.0 | 1,908.0 | 1,584.6 | W | W | 1,374.0 |
| 2010's | 1,197.8 | 773.5 | 567.7 | 276.7 | W | W | W | W | W | W |
| 2020's | W |
| - = No Data Reported; -- = Not Applicable; NA = Not Available; W = Withheld to avoid disclosure of individual company data. |
| Release Date: 6/1/2022 |
| Next Release Date: TBD |