|
Download Data (XLS File) |
|
||||||||
|
||||||||
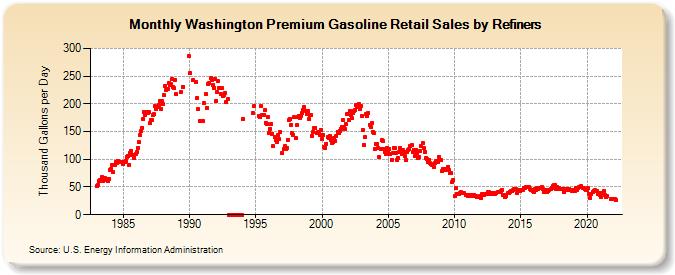
| Washington Premium Gasoline Retail Sales by Refiners (Thousand Gallons per Day) | ||||||||
| Year | Jan | Feb | Mar | Apr | May | Jun | Jul | Aug | Sep | Oct | Nov | Dec |
|---|---|---|---|---|---|---|---|---|---|---|---|---|
| 1983 | 51.8 | 54.4 | 60.5 | 63.2 | 63.4 | 68.3 | 61.0 | 65.6 | 65.3 | 62.8 | 60.2 | 65.2 |
| 1984 | 80.0 | 82.5 | 88.8 | 76.2 | 90.3 | 95.1 | 93.5 | 97.4 | 95.5 | 94.7 | 95.7 | 94.5 |
| 1985 | 91.7 | 94.6 | 97.2 | 103.3 | 106.5 | 90.4 | 112.1 | 115.2 | 108.5 | 108.5 | 102.9 | 109.0 |
| 1986 | 112.5 | 120.8 | 130.3 | 143.1 | 151.1 | 156.9 | 173.0 | 185.2 | 180.5 | 185.1 | 183.0 | 185.4 |
| 1987 | 165.8 | 171.6 | 170.8 | 179.6 | 181.2 | 195.6 | 190.4 | 195.0 | 198.6 | 204.6 | 191.0 | 205.5 |
| 1988 | 199.4 | 215.7 | 231.9 | 225.5 | 226.6 | 238.1 | 233.2 | 235.7 | 245.2 | 231.2 | 228.1 | 243.0 |
| 1989 | 216.9 | W | W | W | 220.7 | W | 231.1 | W | W | W | W | 286.2 |
| 1990 | 255.3 | W | W | 242.5 | W | W | 239.8 | 210.0 | 190.0 | 169.0 | W | W |
| 1991 | 169.2 | 201.0 | W | 217.3 | 192.9 | 235.9 | 237.8 | 246.0 | 243.8 | 233.5 | 228.8 | 244.9 |
| 1992 | 205.4 | 220.5 | 240.7 | 228.1 | 217.6 | 229.2 | 213.7 | 215.4 | 219.7 | 203.4 | W | 208.8 |
| 1993 | 0.0 | 0.0 | 0.0 | 0.0 | 0.0 | 0.0 | 0.0 | 0.0 | 0.0 | 0.0 | 0.0 | 0.0 |
| 1994 | 173.4 | W | W | W | W | W | W | W | W | 183.7 | 195.2 | W |
| 1995 | W | W | W | 178.6 | 176.1 | 195.2 | 179.0 | 179.8 | 188.8 | 165.9 | 163.4 | 176.3 |
| 1996 | 146.6 | 154.7 | 163.6 | 145.7 | 123.1 | 140.3 | 134.0 | 131.8 | 144.1 | 135.9 | 148.9 | NA |
| 1997 | 111.6 | 117.7 | 123.2 | 118.5 | 120.0 | 135.4 | 170.6 | 173.4 | 162.7 | 146.7 | 143.9 | 175.6 |
| 1998 | 138.1 | 161.7 | 177.1 | 178.1 | 175.3 | 177.4 | 183.2 | 189.7 | 194.0 | 187.8 | 182.4 | 187.2 |
| 1999 | 173.4 | 179.9 | 179.8 | 141.8 | 150.0 | 155.8 | 157.3 | 147.6 | 148.3 | 147.5 | 143.0 | 152.4 |
| 2000 | 137.1 | 144.6 | 121.6 | 120.6 | 128.2 | 140.1 | 139.1 | 142.6 | 134.9 | 128.7 | 131.5 | 139.0 |
| 2001 | 133.7 | 141.4 | 150.0 | 147.9 | 151.6 | 155.2 | 157.5 | 170.3 | 158.5 | 154.6 | 163.0 | 181.0 |
| 2002 | 170.9 | 187.2 | 180.2 | 173.7 | 184.2 | 187.9 | 188.3 | 198.3 | 193.7 | 199.9 | 190.9 | 196.3 |
| 2003 | 177.8 | 153.1 | 125.9 | 139.9 | 181.4 | 178.2 | 183.8 | 162.5 | 159.1 | 164.9 | 149.8 | 146.5 |
| 2004 | 118.1 | 127.9 | 127.0 | 120.1 | 103.5 | 118.0 | 134.2 | 132.6 | 119.4 | 113.7 | 108.8 | 120.7 |
| 2005 | 115.6 | 118.8 | 108.7 | 99.4 | 110.7 | 121.0 | 119.6 | 111.8 | 99.0 | 102.7 | 114.0 | 120.5 |
| 2006 | 108.8 | 117.5 | 113.1 | 105.2 | 98.5 | 112.3 | 116.1 | 117.8 | 123.7 | 125.2 | 113.1 | 117.1 |
| 2007 | 105.6 | 117.5 | 111.4 | 102.5 | 103.4 | 115.2 | 124.3 | 129.6 | 120.4 | 113.7 | 102.1 | 99.7 |
| 2008 | 95.5 | 99.5 | 92.6 | 92.3 | 89.8 | 86.8 | 92.6 | 96.8 | 97.3 | 95.9 | 104.3 | 99.5 |
| 2009 | 97.8 | 79.4 | 81.6 | 81.4 | 82.4 | 80.0 | 86.6 | 80.6 | 74.8 | 74.5 | 58.3 | 62.7 |
| 2010 | 33.0 | 48.4 | 38.1 | 38.0 | 37.8 | 39.3 | 40.4 | 40.0 | 39.9 | 38.5 | 35.7 | 36.4 |
| 2011 | 34.6 | 35.5 | 33.5 | 34.7 | 33.4 | 35.1 | 34.9 | 32.9 | 31.9 | 31.6 | 31.2 | 33.9 |
| 2012 | 31.0 | 36.6 | 34.7 | 36.4 | 37.5 | 37.5 | 40.5 | 40.1 | 37.9 | 36.9 | 39.7 | 39.3 |
| 2013 | 36.6 | 38.2 | 39.9 | 40.6 | 40.1 | 41.6 | 42.8 | 44.4 | 36.4 | 36.3 | 31.6 | 32.9 |
| 2014 | 38.7 | 40.0 | 41.7 | 42.0 | 42.4 | 44.3 | 45.8 | 46.2 | 46.6 | 38.5 | 44.1 | 42.4 |
| 2015 | 44.1 | 45.0 | 44.7 | 47.8 | 49.0 | 50.6 | 50.5 | 49.6 | 47.0 | 43.9 | 43.8 | 42.3 |
| 2016 | 40.4 | 45.8 | 45.0 | 47.9 | 46.4 | 48.8 | 47.8 | 49.6 | 46.4 | 41.4 | 41.5 | 43.7 |
| 2017 | 41.6 | 43.3 | 45.1 | 45.5 | 49.0 | 51.3 | 53.0 | 53.2 | 45.8 | 50.4 | 46.9 | 47.5 |
| 2018 | 45.7 | 46.6 | 47.0 | 40.1 | 46.8 | 46.4 | 45.1 | 47.1 | 46.1 | 44.3 | 43.1 | 44.5 |
| 2019 | 43.6 | 43.0 | 48.4 | 45.0 | 48.1 | 49.1 | 50.3 | 51.1 | 48.6 | 47.4 | 45.5 | 44.8 |
| 2020 | 44.2 | 47.7 | 38.0 | 30.0 | 36.7 | 41.1 | 43.6 | 43.9 | 41.9 | 42.0 | 38.0 | 38.5 |
| 2021 | 36.1 | 31.9 | 39.6 | 42.0 | 35.2 | 32.4 | 33.4 | NA | NA | NA | 28.4 | 27.5 |
| 2022 | NA | 29.1 | 27.0 | |||||||||
| - = No Data Reported; -- = Not Applicable; NA = Not Available; W = Withheld to avoid disclosure of individual company data. |
| Release Date: 6/1/2022 |
| Next Release Date: TBD |