|
Download Data (XLS File) |
|
||||||||
|
||||||||
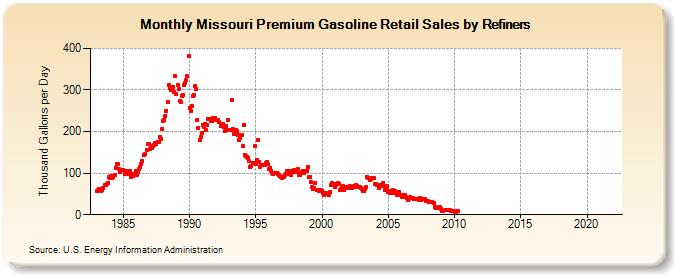
| Missouri Premium Gasoline Retail Sales by Refiners (Thousand Gallons per Day) | ||||||||
| Year | Jan | Feb | Mar | Apr | May | Jun | Jul | Aug | Sep | Oct | Nov | Dec |
|---|---|---|---|---|---|---|---|---|---|---|---|---|
| 1983 | 56.6 | 59.7 | 60.9 | 60.0 | 58.0 | 59.6 | 64.9 | 71.4 | 72.1 | 73.3 | 76.9 | 89.6 |
| 1984 | 89.1 | 93.8 | 87.8 | 91.2 | 94.8 | 111.9 | 122.0 | 121.3 | 110.8 | 102.0 | 107.8 | 108.3 |
| 1985 | 107.2 | 98.0 | 104.9 | 99.2 | 99.1 | 101.7 | 105.8 | 91.6 | 98.8 | 93.3 | 96.0 | 106.1 |
| 1986 | 96.7 | 101.8 | 110.1 | 115.3 | 121.6 | 130.1 | W | 143.2 | 147.1 | 155.9 | 168.9 | 170.5 |
| 1987 | 157.6 | 162.2 | 160.5 | 166.3 | 168.8 | 171.9 | 171.2 | 174.3 | 174.2 | 187.9 | 183.1 | 205.2 |
| 1988 | 225.0 | 228.3 | 238.0 | 250.1 | 270.1 | 311.0 | 304.7 | 299.9 | 298.8 | 308.2 | 296.3 | 332.8 |
| 1989 | 289.6 | 312.6 | 301.3 | 274.4 | 270.5 | 286.6 | 287.0 | 311.2 | 317.1 | 323.5 | 332.9 | 381.2 |
| 1990 | 256.1 | 249.9 | 262.5 | 285.8 | 288.2 | 308.4 | 303.5 | 228.6 | 209.2 | 179.5 | 188.1 | 196.9 |
| 1991 | 216.5 | 211.3 | 218.9 | 203.1 | 215.9 | 230.7 | 231.2 | 224.9 | 225.1 | 233.4 | 229.9 | 233.6 |
| 1992 | 228.1 | 227.0 | 228.7 | 222.0 | 214.2 | W | 217.0 | 209.9 | 201.8 | 214.2 | 204.5 | 227.8 |
| 1993 | 203.0 | 202.7 | 275.6 | 206.5 | 194.4 | 201.9 | 204.4 | 202.3 | 192.2 | 180.4 | 184.8 | 190.7 |
| 1994 | 165.2 | 216.6 | 143.5 | 141.3 | 140.0 | 136.4 | 128.5 | 115.5 | 117.3 | 124.4 | 124.7 | 164.1 |
| 1995 | 120.9 | 131.5 | 179.5 | 126.8 | 114.8 | 120.2 | 120.5 | 120.7 | 118.5 | 123.8 | 126.6 | 121.2 |
| 1996 | 108.8 | 113.2 | 106.2 | 100.7 | 97.5 | 99.4 | 99.2 | 101.1 | 99.1 | 96.0 | 93.3 | 91.4 |
| 1997 | 88.1 | 90.8 | 96.5 | 99.1 | 105.8 | 99.1 | 106.1 | 97.9 | 95.0 | 106.0 | 102.4 | 108.0 |
| 1998 | 104.2 | 103.0 | 109.5 | 96.0 | 96.7 | 100.0 | 103.2 | 104.8 | 100.5 | 104.2 | 105.6 | 115.9 |
| 1999 | 90.6 | 91.2 | 79.3 | 65.6 | 63.0 | 63.6 | 75.4 | 59.9 | 58.7 | 56.9 | 58.5 | 60.5 |
| 2000 | 57.3 | 51.6 | 47.1 | 51.7 | 52.2 | 49.6 | 48.3 | 54.6 | 70.4 | 75.8 | 74.9 | 73.9 |
| 2001 | 65.5 | 70.5 | 77.4 | 74.2 | 58.6 | 62.9 | 63.2 | 67.9 | 58.8 | 67.3 | 67.0 | 64.5 |
| 2002 | 65.7 | 68.4 | 63.8 | 64.2 | 67.0 | 69.0 | 65.7 | 71.0 | 68.3 | 66.1 | 66.2 | 64.1 |
| 2003 | 62.3 | 56.1 | 55.9 | 61.3 | 65.7 | 90.9 | 87.4 | 84.1 | 85.0 | 87.7 | 88.9 | 87.5 |
| 2004 | 74.5 | 73.7 | 72.5 | 72.4 | 64.0 | 71.4 | 69.5 | 75.4 | 70.1 | 59.5 | 62.9 | 68.9 |
| 2005 | 54.4 | 57.4 | 52.9 | 52.6 | 58.7 | 57.0 | 57.4 | 52.5 | 47.1 | 50.0 | 54.7 | 48.1 |
| 2006 | 43.7 | 47.8 | 45.6 | 46.8 | 42.5 | 39.5 | 36.2 | 37.3 | 42.1 | 40.2 | 39.4 | 37.0 |
| 2007 | 37.1 | 37.6 | 38.3 | 37.8 | 35.3 | 39.0 | 36.4 | 38.7 | 37.5 | 37.5 | 33.6 | 32.2 |
| 2008 | 31.9 | 31.0 | 31.4 | 30.7 | 29.5 | 29.2 | 18.5 | 17.0 | 16.6 | 17.2 | 18.5 | 17.5 |
| 2009 | 14.8 | 8.8 | 9.4 | 10.2 | 10.3 | 10.4 | 11.4 | 11.0 | 11.2 | 9.8 | 10.0 | 9.1 |
| 2010 | 7.0 | 7.4 | 8.2 | 9.1 | W | W | W | W | W | W | W | W |
| 2011 | W | W | W | W | W | W | W | W | W | - | - | W |
| 2012 | - | - | - | W | W | - | - | - | - | - | - | - |
| 2013 | - | - | - | - | - | - | - | - | - | - | - | - |
| 2014 | - | - | - | - | - | - | - | W | - | - | - | - |
| 2015 | W | - | - | - | - | - | - | - | - | W | - | - |
| 2016 | - | - | W | - | - | - | - | - | - | - | - | - |
| 2017 | - | W | W | W | - | - | - | - | - | - | - | - |
| 2018 | - | - | - | - | - | - | - | - | - | - | - | - |
| 2019 | - | - | - | - | - | - | - | - | - | - | - | - |
| 2020 | - | - | - | - | - | - | - | - | - | - | - | - |
| 2021 | - | - | - | - | - | - | - | - | W | W | W | W |
| 2022 | W | W | W | |||||||||
| - = No Data Reported; -- = Not Applicable; NA = Not Available; W = Withheld to avoid disclosure of individual company data. |
| Release Date: 6/1/2022 |
| Next Release Date: TBD |