|
Download Data (XLS File) |
|
||||||||
|
||||||||
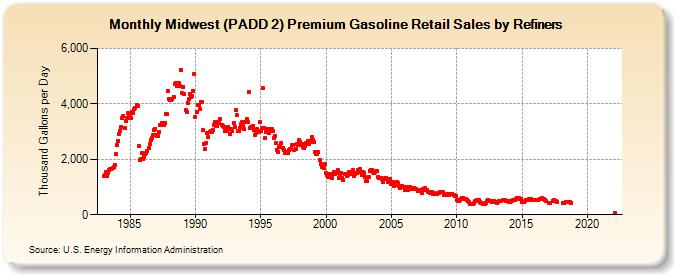
| Midwest (PADD 2) Premium Gasoline Retail Sales by Refiners (Thousand Gallons per Day) | ||||||||
| Year | Jan | Feb | Mar | Apr | May | Jun | Jul | Aug | Sep | Oct | Nov | Dec |
|---|---|---|---|---|---|---|---|---|---|---|---|---|
| 1983 | 1,389.1 | 1,430.7 | 1,533.7 | 1,385.4 | 1,507.7 | 1,612.3 | 1,658.5 | 1,656.8 | 1,699.7 | 1,720.6 | 1,798.5 | 2,201.4 |
| 1984 | 2,529.5 | 2,669.9 | 2,901.5 | 3,002.2 | 3,166.2 | 3,490.6 | 3,561.1 | 3,116.9 | 3,378.6 | 3,485.8 | 3,673.8 | 3,585.8 |
| 1985 | 3,632.6 | 3,489.1 | 3,692.5 | 3,683.2 | 3,808.5 | 3,863.9 | 3,943.4 | 3,930.7 | 2,494.9 | 1,965.4 | 1,995.0 | 2,244.0 |
| 1986 | 1,995.8 | 2,083.1 | 2,199.2 | 2,216.7 | 2,287.0 | 2,402.1 | 2,561.5 | 2,704.4 | 2,774.4 | 2,868.5 | 3,061.4 | 3,103.8 |
| 1987 | 2,872.1 | 2,821.9 | 2,832.0 | 2,989.9 | 3,224.9 | 3,312.9 | 3,281.0 | 3,243.6 | 3,319.1 | 3,641.1 | 3,616.6 | 4,462.3 |
| 1988 | 4,186.2 | 4,139.2 | 4,145.5 | 4,185.5 | 4,249.1 | 4,716.9 | 4,741.7 | 4,637.5 | 4,636.4 | 4,746.3 | 4,638.8 | 5,235.9 |
| 1989 | 4,375.8 | 4,620.9 | 4,356.4 | 3,764.1 | 3,691.1 | 4,031.4 | 4,160.0 | 4,372.3 | 4,236.0 | 4,299.5 | 4,454.6 | 5,073.5 |
| 1990 | 3,530.5 | 3,715.4 | 3,949.5 | 3,947.1 | 3,800.8 | 4,059.5 | 4,048.1 | 3,061.4 | 2,561.7 | 2,375.9 | 2,593.3 | 2,938.2 |
| 1991 | 2,796.0 | 2,976.6 | 3,015.5 | 2,979.6 | 3,053.3 | 3,240.9 | 3,357.7 | 3,207.9 | 3,209.8 | 3,326.8 | 3,296.5 | 3,444.4 |
| 1992 | 3,235.1 | 3,204.8 | 3,168.3 | 3,032.2 | 3,112.6 | 3,003.2 | 3,172.7 | 3,085.5 | 2,908.8 | 3,078.9 | 3,012.2 | 3,321.8 |
| 1993 | 3,171.6 | 3,771.6 | 3,599.5 | 3,024.2 | 3,026.8 | 3,128.5 | 3,262.2 | 3,340.7 | 3,243.0 | 3,085.8 | 3,341.2 | 3,457.1 |
| 1994 | 3,340.2 | 4,409.1 | 3,142.4 | 3,172.8 | 3,158.7 | 3,185.5 | 3,062.5 | 2,858.9 | 2,941.0 | 3,079.4 | 2,983.6 | 3,343.0 |
| 1995 | 3,013.4 | 3,118.3 | 4,565.5 | 3,126.7 | 2,755.1 | 2,984.0 | 3,103.4 | 3,088.0 | 2,941.1 | 3,071.6 | 3,106.6 | 3,015.6 |
| 1996 | 2,783.9 | 2,854.1 | 2,576.5 | 2,319.7 | 2,266.8 | 2,450.9 | 2,481.3 | 2,594.5 | 2,414.0 | 2,339.2 | 2,210.7 | 2,264.7 |
| 1997 | 2,221.6 | 2,214.0 | 2,332.6 | 2,354.6 | 2,377.1 | 2,517.3 | 2,529.4 | 2,328.0 | 2,383.9 | 2,544.9 | 2,505.6 | 2,678.1 |
| 1998 | 2,635.3 | 2,500.3 | 2,561.1 | 2,432.3 | 2,405.7 | 2,490.2 | 2,589.7 | 2,653.8 | 2,537.0 | 2,607.1 | 2,661.5 | 2,787.2 |
| 1999 | 2,705.0 | 2,611.1 | 2,277.5 | 2,186.2 | 2,174.8 | 2,252.2 | 1,973.9 | 1,822.6 | 1,731.3 | 1,801.5 | 1,680.7 | 1,818.4 |
| 2000 | 1,489.7 | 1,418.8 | 1,359.2 | 1,486.3 | 1,426.8 | 1,313.2 | 1,482.8 | 1,543.4 | 1,473.5 | 1,489.8 | 1,499.9 | 1,604.6 |
| 2001 | 1,338.0 | 1,463.5 | 1,502.2 | 1,332.3 | 1,259.5 | 1,460.9 | 1,484.8 | 1,412.2 | 1,425.3 | 1,541.8 | 1,509.7 | 1,485.6 |
| 2002 | 1,489.7 | 1,600.0 | 1,402.1 | 1,451.9 | 1,505.6 | 1,609.5 | 1,567.3 | 1,641.0 | 1,529.4 | 1,440.2 | 1,540.1 | 1,488.5 |
| 2003 | 1,345.0 | 1,219.3 | 1,217.9 | 1,375.7 | 1,568.7 | 1,623.0 | 1,604.1 | 1,532.0 | 1,494.8 | 1,548.4 | 1,574.3 | 1,568.9 |
| 2004 | 1,376.6 | 1,336.3 | 1,313.8 | 1,295.0 | 1,179.3 | 1,289.3 | 1,310.2 | 1,330.7 | 1,305.6 | 1,179.8 | 1,172.7 | 1,304.9 |
| 2005 | 1,119.7 | 1,166.3 | 1,049.9 | 1,054.3 | 1,159.1 | 1,185.1 | 1,137.6 | 1,040.6 | 963.3 | 995.5 | 1,053.6 | 1,004.8 |
| 2006 | 897.7 | 1,006.6 | 949.7 | 894.9 | 949.2 | 1,007.3 | 918.2 | 928.5 | 980.1 | 971.9 | 931.8 | 919.7 |
| 2007 | 857.9 | 858.0 | 886.6 | 897.5 | 798.4 | 920.2 | 905.2 | 945.7 | 907.1 | 889.7 | 818.7 | 792.4 |
| 2008 | 821.4 | 801.6 | 755.6 | 772.5 | 745.0 | 751.7 | 757.0 | 798.9 | 774.4 | 802.8 | 815.5 | 813.6 |
| 2009 | 719.8 | 724.9 | 728.8 | 752.2 | 710.5 | 697.7 | 748.9 | 742.1 | 742.8 | 698.3 | 677.8 | 662.2 |
| 2010 | 539.3 | 507.4 | 511.4 | 545.7 | 582.3 | 597.6 | 594.3 | 583.5 | 554.1 | 529.0 | 487.9 | 444.1 |
| 2011 | 402.3 | 401.4 | 397.3 | 396.6 | 431.3 | 495.6 | 511.3 | 514.8 | 516.7 | 444.7 | 411.7 | 406.2 |
| 2012 | 377.9 | 394.2 | 392.7 | 423.8 | 477.4 | 532.6 | 501.9 | 481.8 | 471.7 | 482.7 | 492.1 | 475.8 |
| 2013 | 448.2 | 429.5 | 457.2 | 488.4 | 507.8 | 498.8 | 513.6 | 543.7 | 533.6 | 500.5 | 494.9 | 481.7 |
| 2014 | 459.5 | 466.8 | 491.7 | 507.6 | 544.5 | 545.4 | 578.2 | 590.9 | 583.0 | 586.8 | 562.2 | 579.5 |
| 2015 | 469.6 | 462.2 | 472.0 | 507.9 | 533.1 | 532.7 | 566.3 | 559.3 | 550.5 | 538.0 | 529.2 | 519.0 |
| 2016 | 516.8 | 530.7 | 521.4 | 543.5 | 560.8 | 575.0 | 585.2 | 572.0 | 568.3 | 525.5 | 485.0 | W |
| 2017 | W | 430.5 | 440.0 | W | 486.3 | 519.2 | 502.8 | 492.1 | 473.0 | W | W | W |
| 2018 | W | 407.4 | 420.9 | W | 456.1 | W | W | 465.9 | 445.3 | 433.9 | W | W |
| 2019 | W | W | W | W | W | W | W | W | W | W | W | W |
| 2020 | W | W | W | W | W | W | W | W | W | W | W | W |
| 2021 | W | W | W | W | W | W | W | W | W | W | W | W |
| 2022 | W | 73.6 | W | |||||||||
| - = No Data Reported; -- = Not Applicable; NA = Not Available; W = Withheld to avoid disclosure of individual company data. |
| Release Date: 6/1/2022 |
| Next Release Date: TBD |