|
Download Data (XLS File) |
|
||||||||
|
||||||||
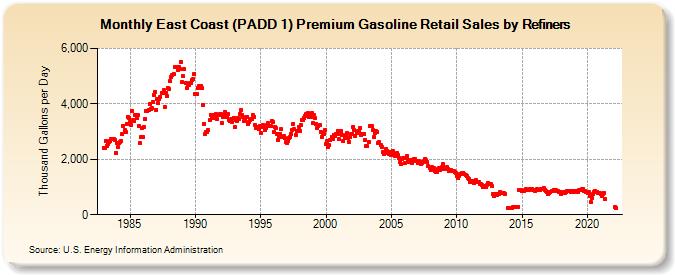
| East Coast (PADD 1) Premium Gasoline Retail Sales by Refiners (Thousand Gallons per Day) | ||||||||
| Year | Jan | Feb | Mar | Apr | May | Jun | Jul | Aug | Sep | Oct | Nov | Dec |
|---|---|---|---|---|---|---|---|---|---|---|---|---|
| 1983 | 2,407.4 | 2,407.4 | 2,666.9 | 2,490.7 | 2,550.2 | 2,624.7 | 2,652.5 | 2,728.4 | 2,742.3 | 2,724.4 | 2,700.5 | 2,229.5 |
| 1984 | 2,596.7 | 2,447.3 | 2,570.8 | 2,625.3 | 2,670.5 | 2,912.9 | 3,213.6 | 3,056.1 | 2,980.8 | 3,272.8 | 3,542.7 | 3,504.4 |
| 1985 | 3,356.3 | 3,238.6 | 3,740.4 | 3,433.0 | 3,363.9 | 3,596.3 | 3,502.4 | 3,582.7 | 3,214.2 | 2,595.3 | 2,789.7 | 3,116.5 |
| 1986 | 2,799.4 | 3,163.1 | 3,449.8 | 3,753.2 | 3,748.7 | 3,770.3 | 3,996.4 | 3,826.0 | 3,837.1 | 4,074.8 | 4,332.7 | 4,436.9 |
| 1987 | 3,789.1 | 4,191.2 | 4,013.8 | 4,169.7 | 4,256.0 | 4,394.8 | 4,381.7 | 4,488.7 | 3,902.2 | 4,408.1 | 4,278.3 | 4,565.4 |
| 1988 | 4,526.9 | 4,811.9 | 4,979.5 | 5,023.5 | 5,079.3 | 5,333.2 | 5,312.2 | 5,335.5 | 5,211.0 | 5,346.6 | 5,249.7 | 5,518.6 |
| 1989 | 4,791.4 | 4,987.9 | 5,255.9 | 4,748.7 | 4,576.7 | 4,675.8 | 4,668.2 | 4,756.1 | 4,755.9 | 4,855.8 | 4,896.9 | 5,079.5 |
| 1990 | 4,351.1 | 4,349.4 | 4,586.2 | 4,635.2 | 4,612.2 | 4,654.9 | 4,557.5 | 3,966.1 | 3,277.7 | 2,896.2 | 2,966.5 | 2,976.6 |
| 1991 | 3,045.4 | 3,416.5 | 3,602.9 | 3,504.5 | 3,481.9 | 3,587.2 | 3,568.5 | 3,631.8 | 3,441.3 | 3,597.2 | 3,591.2 | 3,646.4 |
| 1992 | 3,317.8 | 3,522.3 | 3,625.2 | 3,716.7 | 3,637.3 | 3,537.4 | 3,625.9 | 3,399.1 | 3,366.1 | 3,445.8 | 3,335.1 | 3,499.7 |
| 1993 | 3,169.5 | 3,408.1 | 3,364.6 | 3,506.5 | 3,437.4 | 3,649.8 | 3,777.0 | 3,595.7 | 3,524.7 | 3,395.6 | 3,401.1 | 3,525.7 |
| 1994 | 3,280.2 | 3,335.6 | 3,406.1 | 3,450.2 | 3,447.3 | 3,596.3 | 3,534.5 | 3,235.1 | 3,121.9 | 3,174.4 | 3,091.7 | 3,202.4 |
| 1995 | 2,954.6 | 3,153.3 | 3,245.8 | 3,217.6 | 3,043.7 | 3,141.9 | 3,219.0 | 3,307.2 | 3,194.0 | 3,196.4 | 3,381.2 | 3,339.4 |
| 1996 | 2,977.4 | 3,172.0 | 3,122.5 | 2,907.3 | 2,703.9 | 2,805.8 | 2,913.3 | 3,079.6 | 2,812.1 | 2,825.4 | 2,763.8 | 2,639.2 |
| 1997 | 2,574.4 | 2,642.2 | 2,776.9 | 2,820.9 | 2,910.0 | 3,043.5 | 3,286.0 | 3,075.4 | 2,882.9 | 3,036.7 | 3,026.3 | 3,178.8 |
| 1998 | 3,030.7 | 3,249.8 | 3,418.1 | 3,431.5 | 3,471.0 | 3,548.9 | 3,627.9 | 3,663.9 | 3,526.9 | 3,559.8 | 3,529.5 | 3,669.8 |
| 1999 | 3,303.1 | 3,586.5 | 3,471.4 | 3,279.7 | 3,132.8 | 3,218.2 | 3,233.2 | 2,995.8 | 2,815.6 | 2,910.5 | 2,924.1 | 3,038.3 |
| 2000 | 2,542.1 | 2,642.7 | 2,457.0 | 2,504.8 | 2,704.8 | 2,815.6 | 2,739.1 | 2,887.9 | 2,843.5 | 2,907.5 | 2,906.6 | 3,012.6 |
| 2001 | 2,736.6 | 2,903.2 | 3,002.6 | 2,892.8 | 2,654.9 | 2,768.5 | 2,867.2 | 2,956.3 | 2,776.6 | 2,633.3 | 2,789.2 | 2,928.3 |
| 2002 | 2,927.4 | 3,182.1 | 3,038.0 | 2,847.8 | 2,941.5 | 3,003.7 | 3,004.3 | 3,128.8 | 2,891.5 | 2,923.5 | 2,918.8 | 2,910.7 |
| 2003 | 2,701.5 | 2,481.9 | 2,471.6 | 2,613.0 | 3,208.0 | 3,187.1 | 3,187.9 | 3,054.5 | 2,799.3 | 2,952.9 | 3,005.0 | 2,982.8 |
| 2004 | 2,583.4 | 2,610.9 | 2,522.7 | 2,460.5 | 2,249.8 | 2,199.2 | 2,263.8 | 2,359.2 | 2,302.4 | 2,224.1 | 2,183.5 | 2,274.0 |
| 2005 | 2,162.7 | 2,301.2 | 2,199.3 | 2,127.6 | 2,168.5 | 2,232.2 | 2,144.4 | 2,039.9 | 1,913.4 | 1,828.6 | 2,002.0 | 2,048.9 |
| 2006 | 1,867.7 | 2,042.1 | 2,104.3 | 1,979.4 | 1,883.9 | 1,964.8 | 1,937.5 | 1,876.6 | 1,957.0 | 2,023.9 | 2,006.9 | 1,941.2 |
| 2007 | 1,859.8 | 1,924.1 | 1,885.2 | 1,818.2 | 1,877.8 | 1,905.7 | 1,922.8 | 2,024.8 | 1,959.0 | 1,915.8 | 1,740.1 | 1,680.0 |
| 2008 | 1,627.9 | 1,709.4 | 1,688.8 | 1,673.4 | 1,586.5 | 1,555.9 | 1,547.4 | 1,646.1 | 1,680.9 | 1,630.0 | 1,711.6 | 1,814.2 |
| 2009 | 1,644.6 | 1,673.0 | 1,700.4 | 1,704.7 | 1,661.3 | 1,589.0 | 1,616.7 | 1,620.4 | 1,592.8 | 1,583.3 | 1,527.1 | 1,505.2 |
| 2010 | 1,410.3 | 1,337.6 | 1,405.7 | 1,455.2 | 1,465.2 | 1,513.2 | 1,514.2 | 1,467.7 | 1,427.6 | 1,383.7 | 1,339.7 | 1,281.1 |
| 2011 | 1,167.3 | 1,227.9 | 1,210.0 | 1,167.8 | 1,129.3 | 1,214.6 | 1,241.9 | 1,188.0 | 1,197.3 | 1,090.1 | 1,091.9 | 1,087.3 |
| 2012 | 983.4 | 1,020.7 | 1,012.7 | 1,011.2 | 1,076.5 | 1,138.9 | 1,103.3 | 1,093.6 | 1,019.4 | 733.1 | 661.4 | 744.9 |
| 2013 | 729.2 | 722.1 | 737.8 | 760.8 | 811.2 | 794.8 | 769.2 | 769.9 | 740.8 | NA | NA | 252.6 |
| 2014 | 250.5 | 250.7 | 255.2 | 257.3 | 261.6 | 267.9 | 264.8 | 289.0 | 287.8 | 895.0 | 878.0 | 876.1 |
| 2015 | 856.4 | 860.4 | 871.8 | 898.2 | 917.3 | 873.9 | 894.8 | 922.1 | 934.6 | 938.6 | 898.6 | 896.1 |
| 2016 | 859.5 | 906.4 | 909.7 | 903.1 | 904.9 | 935.2 | 933.6 | 943.6 | 946.7 | 895.8 | 843.8 | 826.9 |
| 2017 | 757.4 | 793.8 | 821.8 | 840.3 | 851.3 | 893.4 | 882.7 | 880.7 | 837.5 | 849.8 | 823.6 | 834.6 |
| 2018 | 751.8 | 774.0 | 805.7 | 798.9 | 815.3 | 858.9 | 841.2 | 849.5 | 840.1 | 812.0 | 836.6 | 843.9 |
| 2019 | 833.2 | 840.1 | 850.3 | 825.8 | 874.3 | 902.2 | 896.4 | 924.6 | 920.1 | 858.5 | 862.1 | 831.1 |
| 2020 | 788.0 | 827.3 | 672.2 | 453.2 | 606.0 | 740.1 | 829.8 | 842.0 | 829.1 | 831.7 | 789.3 | 776.8 |
| 2021 | 729.8 | 681.5 | 755.8 | 797.3 | 552.4 | W | W | W | W | W | W | W |
| 2022 | NA | 260.8 | 248.8 | |||||||||
| - = No Data Reported; -- = Not Applicable; NA = Not Available; W = Withheld to avoid disclosure of individual company data. |
| Release Date: 6/1/2022 |
| Next Release Date: TBD |