|
Download Data (XLS File) |
|
||||||||
|
||||||||
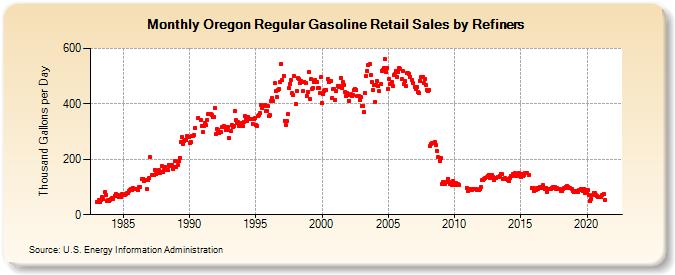
| Oregon Regular Gasoline Retail Sales by Refiners (Thousand Gallons per Day) | ||||||||
| Year | Jan | Feb | Mar | Apr | May | Jun | Jul | Aug | Sep | Oct | Nov | Dec |
|---|---|---|---|---|---|---|---|---|---|---|---|---|
| 1983 | 46.9 | 47.0 | 54.4 | 47.1 | 51.6 | 63.0 | 55.1 | 80.7 | 71.1 | 48.7 | 51.8 | 48.5 |
| 1984 | 54.2 | 55.7 | 59.0 | 57.5 | 67.0 | 76.3 | 69.0 | 71.6 | 65.5 | 67.2 | 65.1 | 73.0 |
| 1985 | 72.5 | 72.4 | 75.6 | 77.9 | 77.1 | 86.5 | 90.2 | 92.8 | 89.6 | 95.6 | 93.5 | 94.1 |
| 1986 | 91.4 | 90.4 | 98.4 | 101.1 | NA | 128.9 | 130.6 | 122.8 | 124.4 | 91.9 | 123.7 | 131.1 |
| 1987 | 206.4 | W | 142.7 | 142.6 | 142.2 | 163.1 | 145.5 | 149.3 | 160.2 | 150.9 | 153.2 | 174.3 |
| 1988 | 153.8 | 162.0 | 173.6 | 164.0 | 161.0 | 180.8 | 174.3 | 180.6 | 179.4 | 164.0 | 170.6 | 192.7 |
| 1989 | 172.4 | 177.6 | 195.1 | 206.3 | 263.5 | 280.4 | 255.2 | 266.7 | 271.1 | 268.3 | 283.8 | 280.2 |
| 1990 | 259.7 | 262.9 | 285.2 | 284.0 | 285.9 | 313.1 | W | W | 350.3 | W | 342.1 | 321.6 |
| 1991 | 297.0 | 319.3 | 329.9 | 323.1 | 341.7 | 364.9 | 363.3 | 361.9 | 360.7 | 350.7 | 352.3 | 384.3 |
| 1992 | 289.9 | 309.4 | 305.7 | 293.6 | 297.6 | 316.1 | 315.5 | 320.0 | 316.8 | 306.1 | 307.0 | 314.9 |
| 1993 | 275.5 | 302.1 | 322.9 | 317.2 | 320.7 | 372.5 | 341.4 | 331.5 | 333.0 | 321.4 | 320.9 | 331.0 |
| 1994 | 318.5 | 335.0 | 354.7 | 349.6 | 339.5 | 353.7 | 346.1 | 345.2 | 343.9 | 328.9 | 344.4 | 347.4 |
| 1995 | 323.8 | 320.4 | 354.4 | 358.9 | 365.9 | 396.3 | 384.9 | 391.7 | 394.0 | 375.5 | 374.4 | 390.8 |
| 1996 | 356.5 | 359.6 | 409.4 | 421.0 | 409.4 | 473.6 | 444.6 | 425.4 | 448.9 | 453.9 | 478.3 | 544.8 |
| 1997 | 485.1 | 500.8 | 338.9 | 324.2 | 337.8 | 361.7 | 456.1 | 472.8 | 485.6 | 437.6 | 432.5 | 500.2 |
| 1998 | 399.3 | 445.8 | 491.6 | 489.3 | 475.6 | 480.8 | 477.4 | 446.7 | 480.5 | 474.8 | 429.1 | 443.7 |
| 1999 | 513.8 | 415.7 | 487.9 | 452.8 | 457.3 | 480.4 | 486.8 | 477.1 | 456.9 | 455.6 | 438.1 | 495.4 |
| 2000 | 401.4 | 434.7 | 447.5 | 449.3 | 449.3 | 488.4 | 477.3 | 483.2 | 482.0 | 421.8 | 455.2 | 454.3 |
| 2001 | 415.0 | 447.9 | 464.4 | 461.8 | 465.3 | 493.0 | 455.8 | 477.1 | 468.9 | 443.0 | 428.6 | 438.2 |
| 2002 | 411.3 | 431.8 | 434.5 | 428.8 | 430.4 | 448.9 | 453.7 | 450.0 | 428.2 | 427.6 | 414.3 | 424.1 |
| 2003 | 393.2 | 391.7 | 370.6 | 439.0 | 500.7 | 518.0 | 540.7 | 542.5 | 504.1 | 479.8 | 450.0 | 466.8 |
| 2004 | 407.8 | 468.6 | 480.7 | 463.3 | 444.9 | 470.3 | 519.9 | 521.5 | 527.5 | 562.5 | 514.5 | 531.0 |
| 2005 | 455.1 | 489.0 | 472.9 | 478.9 | 463.5 | 503.1 | 507.9 | 518.1 | 497.5 | 516.5 | 530.8 | 526.7 |
| 2006 | 488.2 | 518.3 | 471.2 | 482.8 | 462.7 | 512.2 | 510.2 | 509.0 | 496.8 | 485.9 | 475.6 | NA |
| 2007 | 461.9 | 453.9 | 459.7 | 444.4 | 437.7 | 483.3 | 497.0 | 497.5 | 475.4 | 487.8 | 469.6 | 450.6 |
| 2008 | 447.0 | 451.1 | 248.7 | 256.5 | 257.8 | 258.2 | 262.5 | 250.7 | 230.6 | 206.9 | W | 192.5 |
| 2009 | 204.1 | 112.3 | 116.3 | 111.9 | 119.1 | 117.1 | 130.2 | 118.5 | 111.6 | 111.0 | 108.4 | 121.4 |
| 2010 | 105.7 | 114.6 | 106.1 | 109.4 | 108.1 | W | W | W | W | W | W | 95.6 |
| 2011 | 86.9 | 92.8 | 91.5 | 92.2 | 90.4 | 93.1 | 94.0 | 93.2 | 90.0 | 88.6 | 90.3 | 91.2 |
| 2012 | 99.8 | 125.0 | 125.8 | 130.0 | 131.9 | 134.5 | 139.0 | 144.2 | 132.5 | 135.0 | 141.9 | 137.8 |
| 2013 | 126.0 | 132.3 | 133.0 | 136.9 | 136.7 | 141.2 | 147.2 | 145.2 | 127.6 | 127.6 | 131.4 | 130.5 |
| 2014 | 124.6 | 122.1 | 133.3 | 139.0 | 138.0 | 145.4 | 144.6 | 149.5 | 140.4 | 142.4 | 149.1 | 141.0 |
| 2015 | 137.3 | 145.9 | 139.9 | 142.4 | 148.7 | 150.2 | 149.5 | 145.0 | NA | NA | 97.0 | 95.9 |
| 2016 | 84.2 | 90.0 | 89.3 | 95.4 | 92.6 | 100.8 | 97.1 | 99.4 | 105.7 | 96.0 | 93.0 | 98.1 |
| 2017 | 81.6 | 91.1 | 92.3 | 92.2 | 97.1 | 98.9 | 101.6 | 98.8 | 93.3 | 94.7 | 93.2 | 93.4 |
| 2018 | 87.1 | 84.6 | 92.7 | 95.2 | 96.5 | 101.0 | 102.4 | 100.1 | 95.6 | 95.2 | 93.9 | 87.0 |
| 2019 | 80.4 | 81.8 | 85.2 | 85.1 | 83.2 | 90.1 | 90.7 | 91.3 | 86.7 | 92.6 | 80.1 | 87.5 |
| 2020 | 82.7 | 87.6 | 70.0 | 48.0 | 57.2 | 70.7 | 79.5 | 79.7 | 71.0 | 69.3 | 63.3 | 64.9 |
| 2021 | 62.3 | 65.3 | 72.5 | 75.8 | 53.3 | W | W | W | W | W | W | W |
| 2022 | W | W | W | |||||||||
| - = No Data Reported; -- = Not Applicable; NA = Not Available; W = Withheld to avoid disclosure of individual company data. |
| Release Date: 6/1/2022 |
| Next Release Date: TBD |