|
Download Data (XLS File) |
|
||||||||
|
||||||||
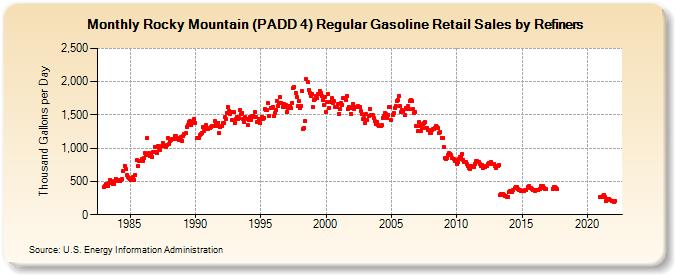
| Rocky Mountain (PADD 4) Regular Gasoline Retail Sales by Refiners (Thousand Gallons per Day) | ||||||||
| Year | Jan | Feb | Mar | Apr | May | Jun | Jul | Aug | Sep | Oct | Nov | Dec |
|---|---|---|---|---|---|---|---|---|---|---|---|---|
| 1983 | 416.4 | 437.9 | 456.3 | 426.7 | 435.4 | 476.7 | 523.7 | 500.6 | 467.0 | 460.0 | 504.2 | 543.2 |
| 1984 | 527.9 | 528.1 | 503.6 | 499.5 | 523.4 | 540.3 | 654.0 | 738.0 | 687.5 | 589.5 | 570.9 | 550.5 |
| 1985 | 532.5 | 529.0 | 515.1 | 572.8 | 523.5 | 597.8 | 815.6 | 736.9 | 812.1 | 808.3 | 811.1 | 837.5 |
| 1986 | 805.0 | 853.0 | 926.8 | 890.4 | 1,159.4 | 923.6 | 882.5 | 903.0 | 867.9 | 949.1 | 946.9 | 1,020.1 |
| 1987 | 936.1 | 927.5 | 1,038.6 | 1,009.7 | 979.1 | 1,026.8 | 1,075.6 | 1,036.4 | 1,026.1 | 1,017.1 | 1,043.4 | 1,155.0 |
| 1988 | 1,068.6 | 1,111.3 | 1,127.6 | 1,139.3 | 1,138.0 | 1,177.2 | 1,185.2 | 1,157.5 | 1,131.4 | 1,126.3 | 1,138.2 | 1,174.4 |
| 1989 | 1,110.2 | 1,176.1 | 1,217.1 | 1,223.3 | 1,320.8 | 1,343.5 | 1,386.7 | 1,404.1 | 1,345.5 | 1,376.8 | 1,381.5 | 1,441.7 |
| 1990 | 1,383.8 | 1,150.0 | 1,145.9 | 1,154.8 | 1,199.6 | 1,210.9 | 1,228.3 | 1,312.5 | 1,262.9 | 1,317.7 | 1,344.9 | 1,289.8 |
| 1991 | 1,295.3 | 1,301.8 | 1,321.0 | 1,327.8 | 1,340.5 | 1,333.8 | 1,404.8 | 1,384.1 | 1,331.2 | 1,385.5 | 1,231.8 | 1,316.3 |
| 1992 | 1,334.4 | 1,381.6 | 1,383.9 | 1,462.8 | 1,439.2 | 1,525.5 | 1,619.2 | 1,559.9 | 1,513.9 | 1,537.3 | 1,425.0 | 1,542.3 |
| 1993 | 1,377.2 | 1,443.0 | 1,472.7 | 1,443.2 | 1,447.3 | 1,574.2 | 1,509.9 | 1,525.6 | 1,435.0 | 1,400.1 | 1,465.9 | 1,434.9 |
| 1994 | 1,348.9 | 1,427.2 | 1,466.2 | 1,423.0 | 1,483.5 | 1,490.8 | 1,467.6 | 1,537.5 | 1,467.6 | 1,389.0 | 1,440.3 | 1,382.7 |
| 1995 | 1,436.0 | 1,469.4 | 1,444.7 | 1,450.4 | 1,593.3 | 1,573.4 | 1,567.9 | 1,674.4 | 1,484.5 | 1,611.1 | 1,604.8 | 1,619.6 |
| 1996 | 1,476.3 | 1,522.7 | 1,568.4 | 1,709.9 | 1,640.2 | 1,685.5 | 1,769.0 | 1,676.1 | 1,618.3 | 1,668.3 | 1,623.9 | 1,656.5 |
| 1997 | 1,542.6 | 1,608.0 | 1,638.6 | 1,636.5 | 1,597.4 | 1,686.2 | 1,902.6 | 1,917.4 | 1,836.8 | 1,766.7 | 1,628.3 | 1,710.5 |
| 1998 | 1,603.6 | 1,636.3 | 1,857.8 | 1,286.7 | 1,301.6 | 1,403.2 | 2,037.0 | 1,987.5 | 1,879.1 | 1,835.4 | 1,783.1 | 1,817.3 |
| 1999 | 1,626.1 | 1,725.6 | 1,745.3 | 1,788.5 | 1,752.2 | 1,810.4 | 1,866.7 | 1,833.2 | 1,784.4 | 1,720.2 | 1,654.2 | 1,770.5 |
| 2000 | 1,546.4 | 1,693.5 | 1,819.0 | 1,610.9 | 1,694.4 | 1,747.9 | 1,684.0 | 1,701.9 | 1,611.8 | 1,622.2 | 1,625.6 | 1,660.5 |
| 2001 | 1,518.0 | 1,592.8 | 1,681.8 | 1,654.1 | 1,761.3 | 1,761.1 | 1,725.5 | 1,791.1 | 1,591.3 | 1,624.3 | 1,603.4 | 1,520.2 |
| 2002 | 1,597.5 | 1,671.5 | 1,595.5 | 1,613.6 | 1,615.3 | 1,628.5 | 1,618.4 | 1,622.9 | 1,554.6 | 1,508.0 | 1,442.3 | 1,456.4 |
| 2003 | 1,380.9 | 1,510.0 | 1,425.1 | 1,483.8 | 1,586.9 | 1,498.3 | 1,503.0 | 1,494.8 | 1,452.4 | 1,404.8 | 1,357.8 | 1,396.7 |
| 2004 | 1,345.7 | 1,330.9 | 1,338.1 | 1,347.5 | 1,460.0 | 1,485.1 | 1,531.9 | 1,514.9 | 1,458.9 | 1,502.6 | 1,618.7 | 1,617.1 |
| 2005 | 1,416.4 | 1,501.8 | 1,534.2 | 1,603.3 | 1,630.3 | 1,709.6 | 1,717.2 | 1,786.3 | 1,629.3 | 1,547.2 | 1,572.9 | 1,558.2 |
| 2006 | 1,492.5 | 1,596.6 | 1,583.8 | 1,628.6 | 1,586.1 | 1,701.9 | 1,721.9 | 1,712.8 | 1,586.8 | 1,532.8 | 1,544.4 | 1,327.1 |
| 2007 | 1,251.1 | 1,396.5 | 1,332.9 | 1,258.7 | 1,302.7 | 1,365.5 | 1,381.7 | 1,387.8 | 1,303.0 | 1,304.9 | 1,279.6 | 1,226.9 |
| 2008 | 1,229.4 | 1,276.7 | 1,281.9 | 1,287.0 | 1,303.5 | 1,340.4 | 1,321.7 | 1,298.0 | 1,232.1 | 1,236.8 | 1,158.2 | 1,156.6 |
| 2009 | 1,018.7 | 845.9 | 839.2 | 858.0 | 902.9 | 925.8 | 918.8 | 893.5 | 851.7 | 841.8 | 809.3 | 827.0 |
| 2010 | 755.8 | 787.0 | 840.1 | 871.2 | 860.3 | 913.7 | 823.5 | 799.5 | 799.1 | 762.3 | 724.8 | 709.6 |
| 2011 | 692.9 | 736.8 | 715.4 | 722.3 | 722.4 | 763.3 | 814.6 | 804.2 | 788.9 | 767.7 | 732.7 | 744.0 |
| 2012 | 696.5 | 713.8 | 709.7 | 725.9 | 733.3 | 765.8 | 771.3 | 789.6 | 754.9 | 766.3 | 762.3 | 730.5 |
| 2013 | 703.1 | 729.7 | 729.4 | 746.7 | 292.7 | 312.7 | 318.1 | 301.1 | 278.0 | 274.3 | 263.3 | 273.5 |
| 2014 | 344.2 | 358.0 | 338.5 | 348.5 | 371.7 | 395.2 | 420.6 | 412.0 | 390.1 | 368.4 | 374.7 | 357.9 |
| 2015 | 350.5 | 351.4 | 359.6 | 364.1 | 374.1 | 417.3 | 425.4 | 406.0 | 400.8 | 388.5 | 367.6 | 367.5 |
| 2016 | 359.6 | 372.0 | 364.9 | 365.7 | 388.3 | 428.2 | 433.0 | 430.6 | 408.7 | 387.8 | 383.0 | W |
| 2017 | W | W | W | W | 391.0 | 416.5 | 411.4 | 407.1 | 384.9 | W | W | W |
| 2018 | W | W | W | W | W | W | W | W | W | W | W | W |
| 2019 | W | W | W | W | W | W | W | W | W | W | W | W |
| 2020 | W | W | W | W | W | W | W | W | W | W | W | 268.7 |
| 2021 | 261.7 | 269.9 | 285.6 | 301.9 | 266.4 | 209.8 | 239.9 | 233.6 | 229.1 | 217.4 | 209.8 | 210.5 |
| 2022 | 196.7 | 211.9 | W | |||||||||
| - = No Data Reported; -- = Not Applicable; NA = Not Available; W = Withheld to avoid disclosure of individual company data. |
| Release Date: 6/1/2022 |
| Next Release Date: TBD |