|
Download Data (XLS File) |
|
||||||||
|
||||||||
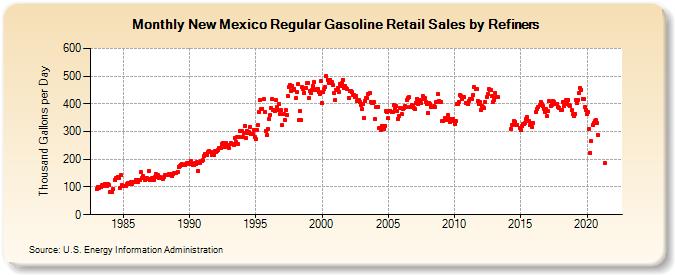
| New Mexico Regular Gasoline Retail Sales by Refiners (Thousand Gallons per Day) | ||||||||
| Year | Jan | Feb | Mar | Apr | May | Jun | Jul | Aug | Sep | Oct | Nov | Dec |
|---|---|---|---|---|---|---|---|---|---|---|---|---|
| 1983 | 93.0 | 98.6 | 97.8 | NA | 98.4 | 105.7 | 104.2 | 112.4 | 108.9 | 103.5 | 109.1 | 106.7 |
| 1984 | 82.6 | 82.9 | 83.7 | 91.8 | 124.5 | 130.9 | 133.2 | 137.7 | 134.0 | 98.0 | 141.6 | 105.5 |
| 1985 | 105.0 | 102.2 | 103.8 | 109.2 | 113.0 | 112.3 | 114.9 | 117.8 | 111.8 | 118.8 | 118.1 | 125.6 |
| 1986 | 118.3 | 117.4 | 126.7 | 124.9 | 152.5 | 131.0 | 139.7 | 133.7 | 126.9 | 132.3 | 130.0 | 157.4 |
| 1987 | 124.8 | 130.0 | 131.3 | 132.6 | 125.6 | 135.4 | 146.4 | 143.6 | 134.0 | 135.7 | 131.0 | 133.7 |
| 1988 | 130.2 | 136.5 | 141.8 | 142.7 | 142.4 | 146.9 | 148.0 | 144.3 | 137.9 | 145.8 | 151.4 | 151.3 |
| 1989 | 149.3 | 155.1 | 172.4 | 176.5 | 181.1 | 181.5 | 177.8 | 178.7 | 180.7 | 182.8 | 184.8 | 185.2 |
| 1990 | 182.1 | 193.8 | 181.7 | 179.4 | 180.3 | 184.8 | 183.1 | 190.0 | 158.4 | 186.0 | 195.3 | 192.5 |
| 1991 | 198.1 | 211.5 | 220.3 | 216.9 | 216.7 | 225.7 | 229.3 | 227.9 | 215.6 | 215.9 | 215.1 | 228.2 |
| 1992 | 224.8 | 230.7 | 235.0 | 238.9 | 242.1 | 255.3 | 258.7 | 254.6 | 244.8 | 259.2 | 247.2 | 250.6 |
| 1993 | 238.9 | 257.9 | 253.9 | 254.8 | 252.4 | 277.1 | 262.6 | 279.1 | 255.9 | 281.7 | 303.2 | 300.7 |
| 1994 | 280.5 | 294.5 | 321.2 | 276.7 | 302.9 | 294.4 | 296.9 | 317.1 | 292.0 | 290.0 | 307.1 | 281.6 |
| 1995 | 272.6 | 305.1 | 321.9 | 371.6 | 412.9 | 382.9 | 382.7 | 416.0 | 371.0 | 303.3 | 286.0 | 309.0 |
| 1996 | 344.7 | 360.0 | 383.5 | 417.1 | 378.2 | 374.6 | 413.4 | 387.8 | 376.6 | 400.9 | 363.1 | 376.3 |
| 1997 | 322.1 | 363.6 | 343.4 | 376.8 | 358.5 | 427.0 | 461.0 | 466.6 | 445.6 | 465.9 | 449.1 | 453.5 |
| 1998 | 420.8 | 441.1 | 470.5 | 341.5 | 372.4 | 342.4 | 459.2 | 453.7 | 440.8 | 457.6 | 473.7 | 476.4 |
| 1999 | 419.5 | 447.4 | 439.8 | 449.6 | 464.1 | 478.4 | 449.5 | 453.3 | 454.6 | 442.7 | 434.0 | 481.5 |
| 2000 | 403.1 | 440.9 | 452.3 | 460.1 | 500.0 | 487.5 | 475.0 | 487.4 | 474.3 | 477.2 | 466.4 | 440.2 |
| 2001 | 414.0 | 448.7 | 458.1 | 443.8 | 470.2 | 463.5 | 475.5 | 487.5 | 457.1 | 464.7 | 455.4 | 453.8 |
| 2002 | 422.4 | 447.4 | 447.0 | 440.9 | 432.4 | 430.9 | 423.3 | 430.0 | 410.7 | 415.3 | 406.5 | 394.5 |
| 2003 | 381.7 | 399.9 | 348.0 | 411.5 | 421.6 | 419.8 | 433.9 | 437.8 | 406.9 | 404.7 | 402.0 | 406.4 |
| 2004 | 344.6 | 387.1 | 387.0 | 389.9 | 312.3 | 307.4 | 319.1 | 315.2 | 310.1 | 321.5 | 373.0 | 371.6 |
| 2005 | 348.3 | 373.8 | 375.1 | 371.5 | 369.9 | 395.2 | 383.5 | 390.4 | 372.5 | 346.1 | 355.3 | 384.7 |
| 2006 | 362.4 | 381.5 | 386.5 | 391.0 | 387.3 | 413.8 | 422.2 | 423.6 | 389.8 | 395.2 | 391.9 | 385.2 |
| 2007 | 381.4 | 402.6 | 418.6 | 398.7 | 401.4 | 412.1 | 401.2 | 428.0 | 415.8 | 419.6 | 406.3 | 399.5 |
| 2008 | 368.7 | 401.9 | 397.8 | 389.0 | 388.6 | 390.6 | 389.3 | 407.0 | 407.3 | 434.8 | 411.5 | 406.3 |
| 2009 | 407.5 | 336.3 | 337.3 | 347.6 | 340.2 | 350.4 | 358.3 | 346.2 | 333.6 | 344.6 | 338.2 | 346.5 |
| 2010 | 327.0 | 339.6 | 398.7 | 397.9 | 406.8 | 431.1 | 427.6 | 416.2 | 423.5 | 424.5 | 403.6 | 402.7 |
| 2011 | 400.2 | 409.3 | 418.3 | 417.5 | 416.9 | 433.2 | 459.9 | 452.6 | 455.3 | 411.9 | 397.8 | 405.4 |
| 2012 | 379.5 | 393.1 | 387.1 | 383.9 | 407.3 | 423.1 | 433.9 | 452.1 | 448.1 | 449.7 | 427.2 | 407.5 |
| 2013 | 415.2 | 440.0 | 426.4 | 424.3 | W | W | W | W | W | W | W | W |
| 2014 | W | W | W | 310.0 | 323.0 | NA | 337.2 | 335.1 | 323.6 | 325.1 | NA | 313.7 |
| 2015 | 305.8 | 318.9 | 328.4 | 326.1 | 332.2 | 345.2 | 350.8 | 338.7 | 323.1 | 330.7 | 315.9 | 330.7 |
| 2016 | NA | NA | 369.8 | 382.6 | 387.3 | 396.7 | 406.0 | 399.9 | 393.9 | 382.7 | 370.2 | 381.2 |
| 2017 | 354.8 | 372.9 | 408.5 | 393.7 | 396.4 | 409.6 | 407.7 | 397.8 | 400.6 | 400.3 | 389.3 | 385.0 |
| 2018 | 378.0 | 378.9 | 407.8 | 392.9 | 399.5 | 413.0 | 406.6 | 414.5 | 397.2 | 393.2 | 377.5 | 361.8 |
| 2019 | 356.5 | 364.6 | 412.6 | 402.6 | 414.9 | 437.9 | 456.4 | 451.3 | 417.8 | 416.3 | 389.3 | 379.0 |
| 2020 | 362.2 | 370.0 | 309.2 | 222.9 | 265.6 | 323.7 | 331.5 | 337.7 | 341.3 | 331.3 | 287.4 | W |
| 2021 | W | W | W | W | 186.6 | W | W | W | W | W | W | W |
| 2022 | W | W | W | |||||||||
| - = No Data Reported; -- = Not Applicable; NA = Not Available; W = Withheld to avoid disclosure of individual company data. |
| Release Date: 6/1/2022 |
| Next Release Date: TBD |