|
Download Data (XLS File) |
|
||||||||
|
||||||||
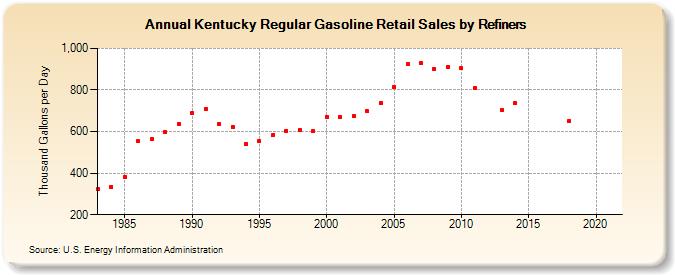
| Kentucky Regular Gasoline Retail Sales by Refiners (Thousand Gallons per Day) | ||||||||
| Decade | Year-0 | Year-1 | Year-2 | Year-3 | Year-4 | Year-5 | Year-6 | Year-7 | Year-8 | Year-9 |
|---|---|---|---|---|---|---|---|---|---|---|
| 1980's | 322.6 | 333.4 | 382.0 | 553.0 | 561.8 | 597.4 | 636.6 | |||
| 1990's | 686.9 | 708.9 | 638.0 | 622.6 | 542.3 | 553.8 | 581.3 | 605.0 | 608.6 | 601.4 |
| 2000's | 672.0 | 670.0 | 674.0 | 697.0 | 738.3 | 814.5 | 922.6 | 927.5 | 902.0 | 909.8 |
| 2010's | 904.0 | 810.8 | W | 705.0 | 735.1 | W | W | W | 651.0 | W |
| 2020's | W |
| - = No Data Reported; -- = Not Applicable; NA = Not Available; W = Withheld to avoid disclosure of individual company data. |
| Release Date: 6/1/2022 |
| Next Release Date: TBD |