|
Download Data (XLS File) |
|
||||||||
|
||||||||
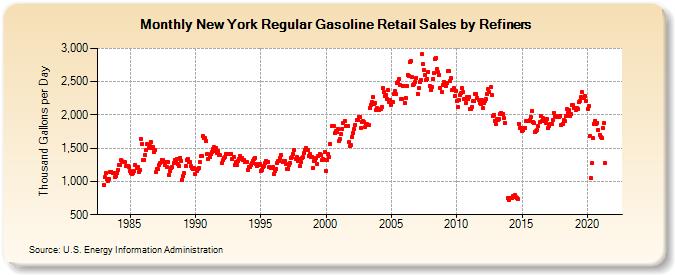
| New York Regular Gasoline Retail Sales by Refiners (Thousand Gallons per Day) | ||||||||
| Year | Jan | Feb | Mar | Apr | May | Jun | Jul | Aug | Sep | Oct | Nov | Dec |
|---|---|---|---|---|---|---|---|---|---|---|---|---|
| 1983 | 945.7 | 1,060.1 | 1,119.6 | 1,042.1 | 999.4 | 1,038.1 | 1,142.3 | 1,146.7 | 1,128.2 | 1,121.5 | 1,059.5 | 1,088.3 |
| 1984 | 1,129.0 | 1,176.0 | 1,247.4 | 1,245.5 | 1,318.0 | 1,303.0 | 1,299.2 | 1,292.9 | 1,228.5 | 1,226.3 | 1,239.5 | 1,216.0 |
| 1985 | 1,154.1 | 1,121.4 | 1,105.3 | 1,123.4 | 1,151.8 | 1,248.8 | 1,206.3 | 1,223.6 | 1,136.4 | 1,170.1 | 1,643.7 | 1,569.5 |
| 1986 | 1,323.3 | 1,329.6 | 1,400.8 | 1,475.7 | 1,563.0 | 1,502.5 | 1,527.4 | 1,596.7 | 1,498.3 | 1,511.8 | 1,438.6 | 1,468.6 |
| 1987 | 1,138.5 | 1,194.1 | 1,181.9 | 1,246.9 | 1,279.5 | 1,326.8 | 1,322.1 | 1,285.5 | 1,240.4 | 1,285.1 | 1,223.3 | 1,295.7 |
| 1988 | 1,097.3 | 1,160.0 | 1,195.1 | 1,216.7 | 1,279.7 | 1,325.6 | 1,302.5 | 1,342.5 | 1,255.4 | 1,230.8 | 1,357.9 | 1,312.4 |
| 1989 | 1,028.0 | 1,081.2 | 1,121.2 | 1,234.4 | 1,329.5 | 1,343.9 | 1,289.6 | 1,290.7 | 1,227.3 | 1,207.8 | 1,187.5 | 1,200.9 |
| 1990 | 1,115.1 | 1,154.8 | 1,189.3 | 1,200.8 | 1,298.6 | 1,377.5 | 1,381.8 | 1,680.9 | 1,648.9 | 1,652.0 | 1,613.1 | 1,413.2 |
| 1991 | 1,343.3 | 1,366.4 | 1,407.6 | 1,440.4 | 1,486.9 | 1,515.9 | 1,454.2 | 1,507.1 | 1,427.8 | 1,453.5 | 1,403.8 | 1,393.5 |
| 1992 | 1,271.4 | 1,315.7 | 1,352.5 | 1,360.1 | 1,416.7 | 1,418.9 | 1,405.3 | 1,419.0 | W | 1,417.8 | 1,341.9 | 1,368.8 |
| 1993 | 1,246.1 | 1,285.4 | 1,254.0 | 1,307.9 | 1,337.4 | 1,375.6 | 1,342.8 | 1,350.7 | 1,323.0 | 1,327.3 | 1,295.9 | 1,296.1 |
| 1994 | 1,175.9 | 1,209.7 | 1,220.5 | 1,246.6 | 1,275.6 | 1,305.1 | 1,331.6 | 1,357.0 | 1,265.5 | 1,234.6 | 1,248.9 | 1,266.4 |
| 1995 | 1,151.7 | 1,179.1 | 1,216.9 | 1,235.9 | 1,272.1 | 1,313.0 | 1,287.6 | 1,296.5 | 1,218.0 | 1,206.6 | 1,197.4 | 1,215.9 |
| 1996 | 1,109.3 | 1,160.5 | 1,191.7 | 1,276.3 | 1,308.2 | 1,304.4 | 1,345.0 | 1,397.9 | 1,285.3 | 1,311.2 | 1,311.6 | 1,269.3 |
| 1997 | 1,189.7 | 1,191.6 | 1,249.1 | 1,284.0 | 1,356.3 | 1,370.0 | 1,408.5 | 1,474.5 | 1,337.5 | 1,370.8 | 1,303.7 | 1,344.6 |
| 1998 | 1,230.7 | 1,295.5 | 1,350.4 | 1,362.4 | 1,424.1 | 1,467.8 | 1,501.5 | 1,470.8 | 1,381.6 | 1,413.5 | 1,360.1 | 1,367.6 |
| 1999 | 1,206.9 | 1,303.4 | 1,314.5 | 1,358.9 | 1,255.7 | 1,388.9 | 1,411.3 | 1,401.8 | 1,314.9 | 1,332.4 | 1,325.8 | 1,436.4 |
| 2000 | 1,156.7 | 1,322.7 | 1,414.0 | 1,364.7 | 1,565.3 | 1,835.4 | 1,831.6 | 1,831.2 | 1,722.6 | 1,759.2 | 1,750.3 | 1,785.3 |
| 2001 | 1,610.3 | 1,633.2 | 1,714.8 | 1,792.8 | 1,883.2 | 1,906.6 | 1,827.3 | 1,840.5 | 1,838.6 | 1,594.9 | 1,529.6 | 1,541.8 |
| 2002 | 1,670.4 | 1,731.0 | 1,788.6 | 1,851.5 | 1,916.5 | 1,921.3 | 1,965.1 | 1,975.2 | 1,804.7 | 1,897.6 | 1,902.8 | 1,892.5 |
| 2003 | 1,818.4 | 1,851.7 | 1,857.5 | 1,848.8 | 2,096.7 | 2,152.5 | 2,191.5 | 2,262.9 | 2,161.1 | 2,173.4 | 2,072.5 | 2,103.1 |
| 2004 | 2,077.9 | 2,067.0 | 2,091.3 | 2,120.2 | 2,402.9 | 2,351.2 | 2,291.3 | 2,306.4 | 2,245.1 | 2,373.2 | 2,186.8 | 2,222.7 |
| 2005 | 2,152.0 | 2,198.4 | 2,312.2 | 2,355.8 | 2,308.7 | 2,486.8 | 2,493.7 | 2,536.7 | 2,449.7 | 2,243.3 | 2,237.1 | 2,440.8 |
| 2006 | 2,177.1 | 2,258.3 | 2,440.6 | 2,599.1 | 2,592.4 | 2,790.1 | 2,815.0 | 2,568.2 | 2,451.3 | 2,468.7 | 2,491.7 | 2,561.2 |
| 2007 | 2,318.2 | 2,402.2 | 2,491.7 | 2,530.1 | 2,911.2 | 2,765.0 | 2,676.5 | 2,603.5 | 2,524.6 | 2,543.1 | 2,651.8 | 2,438.8 |
| 2008 | 2,378.3 | 2,420.8 | 2,537.4 | 2,623.7 | 2,846.1 | 2,855.3 | 2,688.3 | 2,641.2 | 2,601.6 | 2,410.3 | 2,348.5 | 2,447.8 |
| 2009 | 2,497.0 | 2,462.5 | 2,427.7 | 2,486.1 | 2,653.1 | 2,659.2 | 2,502.9 | 2,549.8 | 2,377.1 | 2,398.0 | 2,289.2 | 2,354.4 |
| 2010 | 2,206.5 | 2,120.6 | 2,228.7 | 2,299.2 | 2,325.9 | 2,397.5 | 2,341.4 | 2,245.3 | 2,176.6 | 2,266.6 | 2,238.1 | 2,272.6 |
| 2011 | 2,091.5 | 2,096.2 | 2,125.0 | 2,207.2 | 2,204.6 | 2,308.1 | 2,313.2 | 2,254.7 | 2,228.0 | 2,181.3 | 2,161.2 | 2,220.1 |
| 2012 | 2,098.5 | 2,182.4 | 2,211.5 | 2,232.8 | 2,311.4 | 2,397.0 | 2,337.3 | 2,412.5 | 2,292.7 | 1,977.7 | 2,003.3 | 1,914.8 |
| 2013 | 1,859.9 | 1,935.6 | 1,924.2 | 1,935.6 | 2,012.0 | 2,033.2 | 2,012.9 | 1,958.8 | 1,880.0 | NA | NA | 747.6 |
| 2014 | 727.7 | 756.5 | 757.9 | 751.2 | 774.5 | 797.4 | 772.9 | 754.3 | 738.8 | 1,868.8 | 1,796.0 | 1,796.2 |
| 2015 | 1,756.4 | 1,769.4 | 1,801.8 | 1,807.2 | 1,909.4 | 1,904.9 | 1,905.3 | 1,916.8 | 1,971.8 | 2,062.3 | 1,894.0 | 1,871.6 |
| 2016 | 1,746.6 | 1,755.4 | 1,778.2 | 1,836.5 | 1,889.3 | 1,988.5 | 1,905.6 | 1,948.0 | 1,934.8 | 1,903.2 | 1,884.1 | 1,937.1 |
| 2017 | 1,806.6 | 1,830.4 | 1,868.9 | 1,867.7 | 1,930.2 | 2,036.0 | 1,981.6 | 1,984.8 | 1,970.1 | 1,975.8 | 1,961.8 | 1,990.1 |
| 2018 | 1,844.8 | 1,869.7 | 1,917.2 | 1,912.0 | 1,989.0 | 2,082.9 | 2,025.9 | 2,068.4 | 1,985.3 | 2,011.6 | 2,153.8 | 2,150.2 |
| 2019 | 2,101.5 | 2,074.2 | 2,108.1 | 2,096.1 | 2,190.4 | 2,216.7 | 2,264.5 | 2,340.6 | 2,251.1 | 2,263.3 | 2,278.7 | 2,206.6 |
| 2020 | 2,092.2 | 2,130.6 | 1,676.7 | 1,046.0 | 1,272.5 | 1,646.1 | 1,869.0 | 1,915.3 | 1,867.6 | 1,885.9 | 1,774.8 | 1,705.4 |
| 2021 | 1,667.2 | 1,651.8 | 1,805.2 | 1,874.1 | 1,281.3 | W | W | W | W | W | W | W |
| 2022 | W | W | W | |||||||||
| - = No Data Reported; -- = Not Applicable; NA = Not Available; W = Withheld to avoid disclosure of individual company data. |
| Release Date: 6/1/2022 |
| Next Release Date: TBD |