|
Download Data (XLS File) |
|
||||||||
|
||||||||
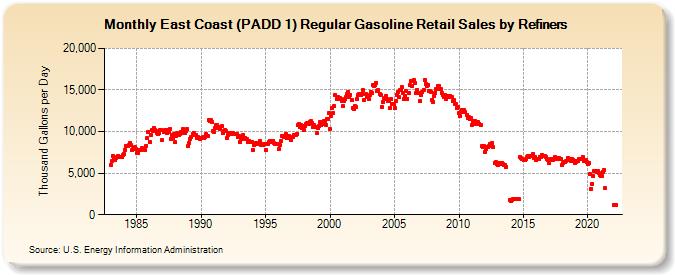
| East Coast (PADD 1) Regular Gasoline Retail Sales by Refiners (Thousand Gallons per Day) | ||||||||
| Year | Jan | Feb | Mar | Apr | May | Jun | Jul | Aug | Sep | Oct | Nov | Dec |
|---|---|---|---|---|---|---|---|---|---|---|---|---|
| 1983 | 6,037.2 | 6,500.3 | 7,030.0 | 6,686.6 | 6,545.7 | 6,821.0 | 6,918.0 | 7,091.5 | 6,931.0 | 6,993.1 | 6,912.4 | 7,178.6 |
| 1984 | 7,308.7 | 7,823.0 | 8,272.5 | 8,319.4 | 8,263.7 | 8,393.0 | 8,640.3 | 8,378.5 | 7,795.7 | 7,921.8 | 8,110.5 | 7,920.4 |
| 1985 | 7,409.1 | 7,367.6 | 7,791.7 | 7,779.7 | 7,796.3 | 7,997.1 | 7,882.7 | 7,930.5 | 7,758.6 | 8,315.1 | 9,166.8 | 9,957.4 |
| 1986 | 8,783.8 | 9,542.6 | 10,171.0 | 10,109.8 | 10,482.3 | 10,238.2 | 10,092.0 | 9,845.1 | 9,683.5 | 9,827.2 | 10,154.9 | 10,132.6 |
| 1987 | 8,950.9 | 9,966.7 | 10,177.1 | 9,983.6 | 9,869.0 | 10,203.6 | 9,934.5 | 10,297.1 | 9,128.9 | 9,614.9 | 9,251.3 | 9,658.4 |
| 1988 | 8,704.6 | 9,442.0 | 9,789.3 | 9,641.7 | 9,713.3 | 9,920.2 | 9,912.8 | 10,253.5 | 9,803.5 | 9,858.1 | 10,021.6 | 10,290.2 |
| 1989 | 8,225.0 | 8,670.3 | 9,116.5 | 9,323.4 | 9,706.9 | 9,870.2 | 9,553.2 | 9,615.9 | 9,252.8 | 9,331.1 | 9,188.7 | 9,124.0 |
| 1990 | 9,248.2 | 9,208.1 | 9,400.0 | 9,193.6 | 9,364.0 | 9,680.5 | 9,470.3 | 11,394.5 | 11,226.3 | 11,369.5 | 11,161.9 | 10,062.6 |
| 1991 | 9,994.7 | 10,399.4 | 10,808.3 | 10,743.6 | 10,604.4 | 10,473.1 | 10,294.9 | 10,612.3 | 9,858.6 | 10,075.5 | 10,141.4 | 10,047.1 |
| 1992 | 9,252.6 | 9,620.1 | 9,806.4 | 9,861.4 | 9,820.7 | 9,752.8 | 9,768.2 | 9,679.0 | 9,655.5 | 9,714.4 | 9,361.1 | 9,476.7 |
| 1993 | 8,768.6 | 9,246.0 | 9,052.7 | 9,529.1 | 9,174.4 | 9,231.2 | 9,123.5 | 9,073.0 | 8,765.4 | 8,912.6 | 8,723.0 | 8,699.8 |
| 1994 | 7,807.1 | 8,324.8 | 8,508.5 | 8,605.1 | 8,513.5 | 8,674.6 | 8,617.8 | 8,863.1 | 8,419.2 | 8,475.5 | 8,363.2 | 8,468.7 |
| 1995 | 7,809.5 | 8,478.9 | 8,535.0 | 8,766.5 | 8,817.5 | 8,916.0 | 8,793.9 | 8,890.3 | 8,578.5 | 8,499.6 | 8,493.0 | 8,551.1 |
| 1996 | 7,900.6 | 8,405.6 | 8,836.9 | 9,484.9 | 9,521.6 | 9,374.7 | 9,451.4 | 9,747.9 | 9,183.6 | 9,429.1 | 9,476.3 | 9,378.4 |
| 1997 | 9,025.1 | 9,327.4 | 9,561.4 | 9,626.1 | 9,585.8 | 9,732.3 | 10,744.3 | 10,950.7 | 10,537.3 | 10,786.3 | 10,485.8 | 10,712.6 |
| 1998 | 10,202.5 | 10,644.4 | 10,958.8 | 10,989.6 | 10,935.9 | 11,142.1 | 11,210.4 | 11,071.0 | 10,543.5 | 10,837.1 | 10,492.4 | 10,584.1 |
| 1999 | 9,769.4 | 10,415.4 | 10,681.3 | 11,165.4 | 10,759.3 | 10,887.9 | 11,234.6 | 11,223.6 | 10,813.2 | 11,480.2 | 11,496.6 | 12,176.4 |
| 2000 | 10,279.6 | 11,869.1 | 12,842.1 | 12,225.5 | 13,044.5 | 14,403.5 | 13,939.0 | 14,169.9 | 13,888.6 | 14,022.7 | 13,881.5 | 13,717.5 |
| 2001 | 13,035.7 | 13,626.0 | 13,867.0 | 14,147.0 | 14,470.5 | 14,801.6 | 14,204.9 | 14,400.4 | 13,754.6 | 12,875.9 | 12,743.0 | 13,057.3 |
| 2002 | 12,972.1 | 13,935.4 | 14,358.0 | 14,459.2 | 14,418.3 | 14,385.6 | 14,571.5 | 14,936.7 | 13,784.8 | 14,510.5 | 14,204.8 | 14,151.4 |
| 2003 | 13,912.2 | 14,359.3 | 14,728.0 | 14,647.9 | 15,609.4 | 15,435.7 | 15,576.0 | 15,892.4 | 14,874.2 | 15,001.3 | 14,556.2 | 14,445.2 |
| 2004 | 13,009.0 | 13,507.4 | 13,875.5 | 14,078.1 | 14,294.6 | 13,877.6 | 13,633.5 | 13,729.6 | 12,810.8 | 13,922.3 | 13,347.0 | 13,322.2 |
| 2005 | 12,888.3 | 13,688.3 | 14,427.9 | 14,703.8 | 14,206.6 | 14,994.8 | 14,940.0 | 15,341.1 | 14,588.4 | 13,917.8 | 14,329.8 | 14,817.3 |
| 2006 | 13,972.0 | 14,665.9 | 15,560.1 | 16,064.4 | 15,451.7 | 16,030.9 | 16,201.9 | 15,795.1 | 14,666.3 | 15,051.0 | 14,690.8 | 14,599.4 |
| 2007 | 13,674.1 | 14,348.4 | 14,759.1 | 15,053.5 | 16,188.6 | 15,754.6 | 15,530.2 | 15,644.1 | 14,894.0 | 14,934.2 | 14,780.5 | 13,837.4 |
| 2008 | 13,602.6 | 14,299.8 | 14,680.0 | 15,084.4 | 15,493.5 | 15,435.0 | 15,129.1 | 15,065.7 | 14,679.0 | 14,395.1 | 14,202.2 | 14,381.2 |
| 2009 | 13,910.3 | 14,261.5 | 14,239.2 | 14,197.5 | 14,325.3 | 14,199.7 | 13,667.9 | 13,845.7 | 13,263.7 | 13,336.5 | 12,889.9 | 12,923.2 |
| 2010 | 12,230.2 | 11,860.3 | 12,401.5 | 12,643.5 | 12,291.2 | 12,572.5 | 12,314.7 | 12,030.3 | 11,659.9 | 11,705.9 | 11,534.0 | 11,614.2 |
| 2011 | 10,844.8 | 11,167.7 | 11,300.3 | 11,260.7 | 10,884.6 | 11,164.8 | 11,148.4 | 10,956.8 | 10,762.2 | 8,226.5 | 8,108.0 | 8,224.7 |
| 2012 | 7,583.6 | 7,949.8 | 8,084.5 | 8,094.7 | 8,258.3 | 8,527.9 | 8,429.5 | 8,647.0 | 8,117.0 | 6,225.3 | 6,310.2 | 6,089.0 |
| 2013 | 5,936.6 | 6,170.6 | 6,150.0 | 6,101.3 | 6,277.5 | 6,095.8 | 5,965.6 | 5,979.9 | 5,713.5 | NA | NA | 1,745.6 |
| 2014 | 1,694.5 | 1,781.7 | 1,878.1 | 1,928.1 | 1,914.9 | 1,926.6 | 1,890.8 | 1,887.6 | 1,840.9 | 6,922.5 | 6,776.4 | 6,723.8 |
| 2015 | 6,523.9 | 6,520.6 | 6,640.7 | 6,897.2 | 7,118.7 | 6,975.3 | 7,023.0 | 7,086.2 | 7,082.5 | 7,278.3 | 6,806.3 | 6,919.7 |
| 2016 | 6,537.7 | 6,674.1 | 6,708.8 | 6,919.7 | 6,966.5 | 7,221.1 | 7,036.8 | 7,066.2 | 7,040.2 | 6,940.8 | 6,735.5 | 6,572.8 |
| 2017 | 6,165.7 | 6,549.3 | 6,679.5 | 6,627.3 | 6,729.3 | 6,928.1 | 6,728.1 | 6,861.3 | 6,706.9 | 6,855.4 | 6,719.3 | 6,708.4 |
| 2018 | 5,988.6 | 6,250.1 | 6,358.3 | 6,308.9 | 6,491.8 | 6,769.7 | 6,546.9 | 6,754.1 | 6,464.1 | 6,644.5 | 6,631.4 | 6,472.4 |
| 2019 | 6,255.5 | 6,298.9 | 6,466.7 | 6,433.8 | 6,710.5 | 6,678.0 | 6,681.6 | 6,895.3 | 6,469.8 | 6,569.6 | 6,534.9 | 6,304.1 |
| 2020 | 6,073.8 | 6,162.8 | 4,851.5 | 3,101.5 | 3,709.5 | 4,638.5 | 5,209.8 | 5,272.3 | 5,158.1 | 5,252.9 | 4,959.8 | 4,828.4 |
| 2021 | 4,667.0 | 4,674.6 | 5,176.7 | 5,381.4 | 3,180.0 | W | W | W | W | W | W | W |
| 2022 | 1,135.6 | 1,175.8 | 1,185.5 | |||||||||
| - = No Data Reported; -- = Not Applicable; NA = Not Available; W = Withheld to avoid disclosure of individual company data. |
| Release Date: 6/1/2022 |
| Next Release Date: TBD |