|
Download Data (XLS File) |
|
||||||||
|
||||||||
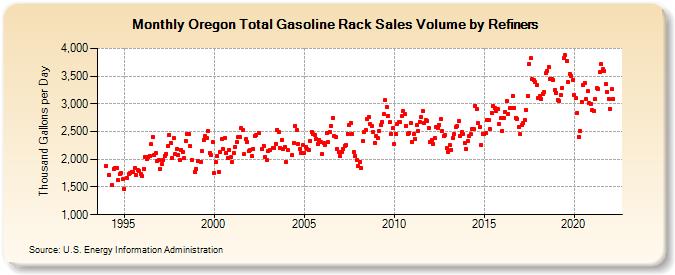
| Oregon Total Gasoline Rack Sales Volume by Refiners (Thousand Gallons per Day) | ||||||||
| Year | Jan | Feb | Mar | Apr | May | Jun | Jul | Aug | Sep | Oct | Nov | Dec |
|---|---|---|---|---|---|---|---|---|---|---|---|---|
| 1994 | 1,887.5 | W | 1,716.2 | W | 1,536.9 | 1,824.9 | 1,840.3 | 1,835.8 | 1,623.5 | 1,729.6 | 1,745.0 | 1,636.4 |
| 1995 | 1,468.0 | W | 1,666.2 | 1,734.7 | 1,745.3 | 1,771.5 | 1,772.0 | 1,839.5 | 1,715.9 | 1,801.8 | 1,792.6 | 1,736.5 |
| 1996 | 1,696.3 | 1,824.6 | 2,042.2 | 1,997.0 | 2,037.7 | 2,065.0 | 2,270.0 | 2,404.1 | 2,071.3 | 2,109.3 | 1,963.9 | 1,982.5 |
| 1997 | 1,822.7 | 1,910.0 | 1,983.5 | 2,061.4 | 2,102.3 | 2,238.0 | 2,436.6 | 2,302.0 | 2,020.8 | 2,379.1 | 2,088.4 | 2,184.7 |
| 1998 | 2,080.9 | 1,987.4 | 2,176.0 | 2,127.5 | 2,022.2 | 2,325.3 | 2,456.5 | 2,455.1 | 2,238.1 | 1,987.6 | W | 1,776.1 |
| 1999 | 1,832.4 | 1,972.8 | W | 1,953.5 | 2,148.8 | 2,356.6 | 2,423.9 | 2,380.1 | 2,506.4 | 2,113.3 | 2,075.4 | 2,309.9 |
| 2000 | 1,750.0 | 1,952.2 | 2,062.5 | 1,768.8 | 2,132.7 | 2,356.8 | 2,188.3 | 2,384.5 | 2,108.7 | 2,022.4 | 2,168.6 | 2,032.9 |
| 2001 | 1,953.3 | 2,111.2 | 2,228.5 | 2,305.5 | 2,396.9 | 2,399.1 | 2,563.7 | 2,535.3 | 2,087.9 | 2,359.4 | 2,311.9 | 2,147.7 |
| 2002 | 2,165.7 | 2,054.0 | 2,188.1 | 2,424.0 | 2,432.4 | W | 2,469.7 | W | 2,193.1 | 2,245.3 | 2,048.8 | 1,978.9 |
| 2003 | 2,143.3 | 2,164.8 | W | 2,211.3 | 2,208.4 | 2,282.6 | 2,533.1 | 2,489.8 | 2,199.2 | 2,356.2 | 2,183.3 | 2,220.8 |
| 2004 | 1,949.5 | 2,163.5 | W | W | 2,075.0 | 2,301.7 | 2,609.0 | 2,525.2 | 2,283.4 | 2,187.8 | 2,109.2 | 2,261.8 |
| 2005 | 2,113.9 | 2,228.4 | 2,182.8 | 2,170.9 | 2,334.3 | 2,494.8 | 2,455.7 | 2,443.7 | 2,371.3 | 2,282.9 | 2,347.8 | 2,315.1 |
| 2006 | 2,096.9 | 2,284.7 | 2,265.7 | 2,474.6 | 2,306.0 | 2,498.0 | 2,605.8 | 2,747.2 | 2,416.5 | 2,399.3 | 2,194.2 | 2,128.1 |
| 2007 | 2,052.8 | 2,124.1 | 2,176.9 | 2,240.5 | 2,253.4 | 2,463.6 | 2,616.2 | 2,659.6 | 2,460.6 | 2,133.0 | 2,067.9 | 1,981.5 |
| 2008 | 1,884.1 | 1,945.8 | 1,840.0 | 2,325.7 | 2,494.1 | 2,522.3 | 2,717.6 | 2,770.3 | 2,628.8 | 2,603.6 | 2,495.2 | 2,301.1 |
| 2009 | 2,423.3 | 2,374.9 | 2,515.8 | 2,615.3 | 2,675.1 | 2,814.7 | 3,060.4 | 2,948.0 | 2,784.2 | 2,667.7 | 2,463.8 | 2,559.7 |
| 2010 | 2,270.5 | 2,461.0 | 2,630.9 | 2,668.7 | 2,665.9 | 2,774.0 | 2,864.7 | 2,817.5 | 2,606.2 | 2,458.1 | 2,480.7 | 2,652.8 |
| 2011 | 2,319.5 | 2,449.7 | 2,374.4 | 2,609.3 | 2,517.2 | 2,681.1 | 2,754.8 | 2,876.9 | 2,656.7 | 2,705.5 | 2,695.9 | 2,568.5 |
| 2012 | 2,307.1 | 2,346.5 | 2,271.9 | 2,380.6 | 2,575.0 | 2,561.9 | 2,623.0 | 2,724.4 | 2,512.6 | 2,418.2 | 2,438.3 | 2,198.8 |
| 2013 | 2,126.2 | 2,256.6 | 2,174.7 | 2,380.6 | 2,456.5 | 2,574.0 | 2,591.5 | 2,683.0 | 2,411.2 | 2,487.3 | 2,452.3 | 2,298.1 |
| 2014 | 2,187.5 | 2,327.5 | 2,417.0 | 2,449.3 | 2,544.5 | 2,537.8 | 2,967.8 | 2,903.9 | 2,647.8 | 2,579.3 | 2,264.6 | 2,454.2 |
| 2015 | 2,453.4 | 2,474.5 | 2,715.0 | 2,710.9 | 2,539.7 | 2,841.8 | 2,958.8 | 2,927.8 | 2,868.6 | 2,915.6 | 2,644.5 | 2,735.5 |
| 2016 | 2,510.8 | 2,747.7 | 2,843.9 | 3,044.1 | 2,824.7 | 2,925.3 | 2,932.8 | 3,146.0 | 2,925.1 | 2,751.5 | 2,732.3 | 2,583.5 |
| 2017 | 2,449.8 | 2,621.9 | 2,646.3 | 2,713.7 | 2,893.2 | 3,138.8 | 3,724.4 | 3,821.6 | 3,441.6 | 3,421.6 | 3,392.7 | 3,348.3 |
| 2018 | 3,106.4 | 3,143.3 | 3,083.7 | 3,184.9 | 3,209.5 | 3,547.1 | 3,599.2 | 3,670.0 | 3,445.7 | 3,455.4 | 3,432.0 | 3,255.6 |
| 2019 | 3,200.9 | 3,076.8 | 3,047.6 | 3,163.7 | 3,288.5 | 3,818.9 | 3,874.9 | 3,773.4 | 3,397.3 | 3,536.8 | 3,505.4 | 3,423.5 |
| 2020 | 3,160.1 | 3,111.4 | 2,839.7 | 2,404.5 | 2,508.7 | 3,037.8 | 3,340.9 | 3,384.4 | 3,085.5 | 3,231.3 | 3,012.9 | 3,003.6 |
| 2021 | 2,883.2 | 2,874.9 | 3,088.0 | 3,279.6 | 3,273.6 | 3,566.7 | 3,716.5 | 3,620.8 | 3,589.3 | 3,353.0 | 3,221.9 | 3,092.3 |
| 2022 | 2,914.7 | 3,267.3 | 3,079.0 | |||||||||
| - = No Data Reported; -- = Not Applicable; NA = Not Available; W = Withheld to avoid disclosure of individual company data. |
| Release Date: 6/1/2022 |
| Next Release Date: TBD |