|
Download Data (XLS File) |
|
||||||||
|
||||||||
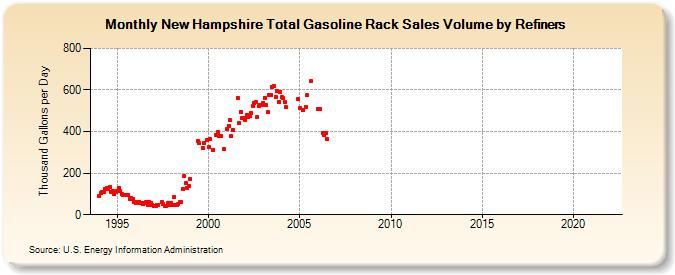
| New Hampshire Total Gasoline Rack Sales Volume by Refiners (Thousand Gallons per Day) | ||||||||
| Year | Jan | Feb | Mar | Apr | May | Jun | Jul | Aug | Sep | Oct | Nov | Dec |
|---|---|---|---|---|---|---|---|---|---|---|---|---|
| 1994 | 90.9 | 105.3 | 108.6 | 107.9 | 121.6 | 127.1 | 121.4 | 133.8 | 110.7 | 113.0 | 97.7 | 109.3 |
| 1995 | 116.2 | 127.3 | 112.0 | 98.7 | 93.7 | 93.4 | 94.2 | 95.9 | 77.2 | 80.6 | 76.1 | 59.5 |
| 1996 | 57.9 | 62.9 | 59.0 | 57.3 | 55.3 | 51.6 | 55.6 | 60.0 | 48.5 | 61.7 | 54.2 | 45.8 |
| 1997 | 42.6 | 44.1 | 48.9 | 47.5 | W | 60.1 | 50.1 | 43.2 | 43.1 | 56.6 | 48.9 | 58.3 |
| 1998 | 47.4 | 82.9 | 46.5 | 44.5 | 53.5 | 59.7 | 60.4 | 122.7 | 185.2 | 153.6 | 130.6 | 138.1 |
| 1999 | 173.1 | W | W | W | W | 355.7 | 342.8 | W | 319.7 | 344.5 | W | 359.0 |
| 2000 | 326.1 | 362.8 | W | 313.5 | W | 385.7 | 397.9 | 378.1 | 377.4 | W | 314.9 | W |
| 2001 | 413.4 | 428.9 | 453.8 | 378.5 | 408.4 | W | W | 562.2 | 438.9 | 494.6 | 465.6 | 464.7 |
| 2002 | 457.6 | 479.0 | 467.8 | 474.4 | 490.0 | 521.5 | 537.9 | 542.6 | 469.9 | 522.7 | 530.1 | 526.0 |
| 2003 | 537.5 | 562.8 | 527.8 | 491.9 | 577.1 | 577.7 | 614.1 | 618.5 | 565.1 | 595.3 | 540.6 | 591.8 |
| 2004 | 564.1 | 559.7 | 540.1 | 516.1 | W | W | W | W | W | W | W | 554.7 |
| 2005 | 513.8 | W | 501.3 | W | 518.4 | 574.8 | W | 640.9 | W | W | W | W |
| 2006 | 508.7 | 509.1 | W | 393.5 | 383.7 | 394.4 | 363.4 | W | W | W | W | W |
| 2007 | W | W | W | W | W | W | W | W | W | W | W | W |
| 2008 | W | W | W | W | W | W | W | W | W | W | W | W |
| 2009 | W | W | W | W | W | W | W | W | W | W | W | W |
| 2010 | W | W | W | W | W | W | W | W | W | W | W | W |
| 2011 | W | W | W | W | W | W | W | W | W | W | W | W |
| 2012 | W | W | W | W | W | W | W | W | W | W | W | W |
| 2013 | W | W | W | W | W | W | W | W | W | W | W | W |
| 2014 | W | W | W | W | W | W | W | W | W | W | W | W |
| 2015 | W | W | W | W | W | W | W | W | W | W | W | W |
| 2016 | W | W | W | W | W | W | W | W | W | W | W | W |
| 2017 | W | W | W | W | W | W | W | W | W | W | W | W |
| 2018 | W | W | W | W | W | W | W | W | W | W | W | W |
| 2019 | W | W | W | W | W | W | W | W | W | W | W | W |
| 2020 | W | W | W | W | W | W | W | W | W | W | W | W |
| 2021 | W | W | W | W | W | W | W | W | W | W | W | W |
| 2022 | W | W | W | |||||||||
| - = No Data Reported; -- = Not Applicable; NA = Not Available; W = Withheld to avoid disclosure of individual company data. |
| Release Date: 6/1/2022 |
| Next Release Date: TBD |