|
Download Data (XLS File) |
|
||||||||
|
||||||||
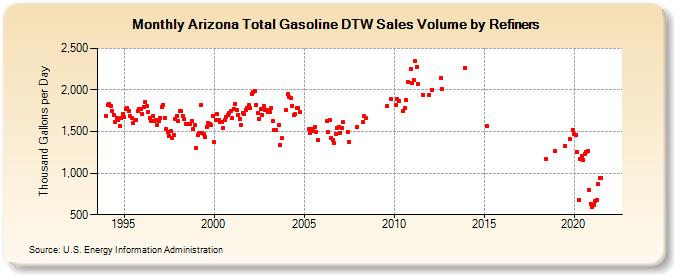
| Arizona Total Gasoline DTW Sales Volume by Refiners (Thousand Gallons per Day) | ||||||||
| Year | Jan | Feb | Mar | Apr | May | Jun | Jul | Aug | Sep | Oct | Nov | Dec |
|---|---|---|---|---|---|---|---|---|---|---|---|---|
| 1994 | 1,689.9 | 1,816.7 | 1,834.9 | 1,803.3 | 1,746.4 | 1,703.3 | 1,618.2 | 1,666.1 | 1,640.4 | 1,570.5 | 1,657.7 | 1,716.7 |
| 1995 | 1,670.8 | 1,769.2 | 1,782.7 | 1,749.6 | 1,683.9 | 1,662.9 | 1,601.5 | 1,637.5 | 1,640.4 | 1,753.0 | 1,768.6 | 1,775.1 |
| 1996 | 1,715.4 | 1,796.4 | 1,852.6 | 1,802.6 | 1,740.5 | 1,666.7 | 1,632.6 | 1,692.5 | 1,625.6 | 1,639.6 | 1,582.9 | 1,628.8 |
| 1997 | 1,666.5 | 1,797.9 | 1,822.3 | 1,667.2 | 1,526.7 | 1,491.3 | 1,452.1 | 1,502.4 | 1,428.0 | 1,452.9 | 1,655.8 | 1,690.7 |
| 1998 | 1,624.8 | 1,741.4 | 1,742.5 | 1,690.6 | 1,647.9 | 1,596.3 | 1,594.9 | 1,594.1 | 1,591.4 | 1,630.8 | 1,527.0 | 1,579.7 |
| 1999 | 1,298.3 | 1,453.8 | 1,478.0 | 1,815.3 | 1,479.8 | 1,466.3 | 1,439.1 | 1,556.3 | 1,606.3 | 1,592.0 | 1,580.3 | 1,690.4 |
| 2000 | 1,379.5 | 1,637.5 | 1,707.2 | 1,644.6 | 1,619.5 | 1,617.0 | 1,546.6 | 1,637.7 | 1,676.6 | 1,694.5 | 1,726.7 | 1,743.2 |
| 2001 | 1,657.3 | 1,774.7 | 1,828.6 | 1,761.1 | 1,704.5 | 1,654.6 | 1,582.6 | 1,722.9 | 1,712.5 | 1,762.9 | 1,780.6 | 1,813.5 |
| 2002 | 1,777.9 | 1,957.4 | 1,971.9 | 1,992.5 | 1,822.0 | 1,723.4 | 1,654.6 | 1,768.5 | 1,704.7 | 1,806.7 | 1,755.0 | 1,754.4 |
| 2003 | 1,733.8 | 1,738.5 | 1,784.5 | 1,628.1 | 1,515.9 | 1,515.4 | W | 1,575.5 | 1,335.5 | 1,419.1 | W | W |
| 2004 | 1,761.0 | 1,949.2 | 1,919.2 | 1,898.3 | 1,813.2 | 1,693.4 | 1,707.7 | 1,782.7 | 1,782.9 | 1,730.4 | W | W |
| 2005 | W | W | W | 1,529.9 | 1,478.1 | 1,532.6 | 1,509.2 | 1,559.2 | 1,499.9 | 1,396.2 | W | W |
| 2006 | W | W | W | 1,625.6 | 1,497.5 | 1,636.7 | 1,423.9 | 1,399.8 | 1,360.7 | 1,470.2 | 1,547.2 | 1,555.6 |
| 2007 | 1,484.0 | 1,540.0 | 1,609.7 | W | W | 1,497.8 | 1,379.7 | W | W | W | W | 1,550.0 |
| 2008 | W | W | W | 1,620.2 | 1,686.5 | 1,660.8 | W | W | W | W | W | W |
| 2009 | W | W | W | W | W | W | W | 1,804.9 | W | W | 1,887.1 | W |
| 2010 | W | 1,823.3 | 1,888.7 | 1,868.7 | W | W | 1,746.7 | 1,786.1 | 1,880.8 | 2,098.5 | W | 2,255.5 |
| 2011 | 2,082.6 | 2,117.4 | 2,342.4 | 2,278.3 | 2,072.2 | W | W | 1,944.1 | W | W | W | 1,937.2 |
| 2012 | W | 2,005.2 | W | W | W | W | W | 2,144.6 | 2,014.8 | W | W | W |
| 2013 | W | W | W | W | W | W | W | W | W | W | W | 2,258.5 |
| 2014 | W | W | W | W | W | W | W | W | W | W | W | W |
| 2015 | W | W | 1,562.4 | W | W | W | W | W | W | W | W | W |
| 2016 | W | W | W | W | W | W | W | W | W | W | W | W |
| 2017 | W | W | W | W | W | W | W | W | W | W | W | W |
| 2018 | W | W | W | W | W | 1,166.2 | W | W | W | W | W | 1,266.8 |
| 2019 | W | W | W | W | W | W | 1,331.9 | W | W | 1,409.3 | W | 1,519.0 |
| 2020 | 1,465.8 | 1,459.3 | 1,249.8 | 672.1 | 1,170.6 | 1,210.5 | 1,156.8 | 1,224.7 | 1,258.9 | 1,265.3 | 794.3 | 632.5 |
| 2021 | 587.4 | 620.1 | 667.2 | 677.0 | 868.3 | 944.4 | 943.3 | W | W | W | W | W |
| 2022 | W | W | W | |||||||||
| - = No Data Reported; -- = Not Applicable; NA = Not Available; W = Withheld to avoid disclosure of individual company data. |
| Release Date: 6/1/2022 |
| Next Release Date: TBD |