|
Download Data (XLS File) |
|
||||||||
|
||||||||
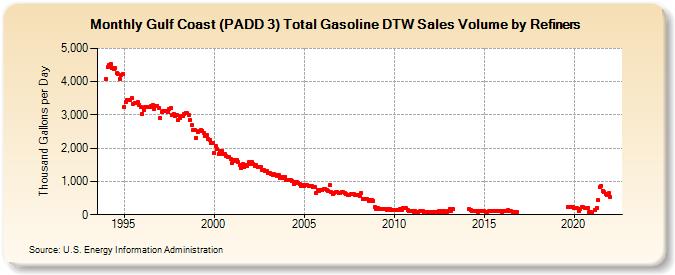
| Gulf Coast (PADD 3) Total Gasoline DTW Sales Volume by Refiners (Thousand Gallons per Day) | ||||||||
| Year | Jan | Feb | Mar | Apr | May | Jun | Jul | Aug | Sep | Oct | Nov | Dec |
|---|---|---|---|---|---|---|---|---|---|---|---|---|
| 1994 | 4,085.9 | 4,435.2 | 4,498.2 | 4,533.0 | 4,395.7 | 4,394.4 | 4,397.5 | 4,253.2 | 4,219.8 | 4,092.9 | 4,186.2 | 4,215.9 |
| 1995 | 3,235.4 | 3,402.1 | 3,444.8 | 3,448.0 | 3,463.5 | 3,499.5 | 3,337.9 | 3,366.1 | 3,363.3 | 3,391.9 | 3,309.9 | 3,241.8 |
| 1996 | 3,040.4 | 3,132.9 | 3,229.6 | 3,228.4 | 3,251.1 | 3,236.2 | 3,260.4 | 3,312.9 | 3,190.9 | 3,270.8 | 3,277.4 | 3,222.5 |
| 1997 | 2,914.7 | 3,082.9 | 3,106.1 | 3,110.0 | 3,125.4 | 3,095.1 | 3,163.0 | 3,194.6 | 3,011.5 | 3,039.9 | 2,966.1 | 2,998.3 |
| 1998 | 2,835.2 | 2,920.5 | 2,980.5 | 2,981.7 | 3,015.0 | 3,069.1 | 3,048.8 | 2,983.8 | 2,858.7 | 2,684.2 | 2,552.7 | 2,555.6 |
| 1999 | 2,316.8 | 2,474.1 | 2,513.0 | 2,533.1 | 2,519.8 | 2,457.4 | 2,354.0 | 2,385.9 | 2,280.3 | 2,257.1 | 2,151.3 | 2,150.5 |
| 2000 | 1,850.2 | 2,051.6 | 1,971.8 | 1,823.5 | 1,920.3 | 1,902.6 | 1,811.8 | 1,822.4 | 1,756.5 | 1,746.8 | 1,742.2 | 1,689.1 |
| 2001 | 1,566.8 | 1,642.2 | 1,615.7 | 1,642.1 | 1,579.9 | 1,506.5 | 1,410.3 | 1,513.3 | 1,421.3 | 1,506.1 | 1,464.4 | 1,573.6 |
| 2002 | 1,528.6 | 1,590.1 | 1,527.1 | 1,469.4 | 1,482.9 | 1,446.6 | 1,429.7 | 1,431.5 | 1,352.7 | 1,331.2 | 1,319.1 | 1,311.1 |
| 2003 | 1,242.9 | 1,253.4 | 1,212.7 | 1,185.4 | 1,214.0 | 1,190.8 | 1,171.2 | 1,185.4 | 1,099.1 | 1,119.8 | 1,089.9 | 1,136.2 |
| 2004 | 1,038.0 | 1,054.8 | 1,046.7 | 1,040.1 | 1,000.7 | 913.4 | 974.1 | 995.3 | 966.6 | 916.1 | 869.7 | 888.3 |
| 2005 | 862.5 | 899.8 | 886.4 | 868.2 | 865.5 | 859.1 | 831.0 | 821.0 | 647.9 | 734.5 | 720.1 | 751.0 |
| 2006 | 733.0 | 764.4 | 767.9 | 746.4 | 726.0 | 892.4 | 674.7 | 626.8 | 658.2 | 682.8 | 684.5 | 654.7 |
| 2007 | 648.5 | 686.1 | 681.0 | 645.8 | 627.4 | 602.7 | 592.7 | 608.0 | 618.2 | 633.4 | 603.7 | 590.5 |
| 2008 | 595.7 | 548.0 | 665.0 | 469.0 | 475.5 | 473.4 | 465.4 | 419.7 | 429.9 | 441.5 | 409.1 | 234.2 |
| 2009 | 183.7 | 202.8 | 169.2 | 175.4 | 180.8 | 172.2 | 168.9 | 154.0 | 170.7 | 163.1 | 155.0 | 150.0 |
| 2010 | 145.2 | 144.7 | 144.2 | 146.9 | 165.5 | 149.3 | 197.8 | 188.4 | 192.9 | 132.0 | 123.5 | 112.2 |
| 2011 | 99.5 | 89.4 | 98.1 | 90.9 | 91.3 | 103.1 | 111.3 | 98.3 | 90.5 | 88.9 | 82.1 | 77.2 |
| 2012 | 85.9 | 89.1 | 82.1 | 82.0 | 80.8 | 89.8 | 101.9 | 90.3 | 117.4 | 119.4 | 93.6 | 76.9 |
| 2013 | 126.6 | 173.9 | 123.5 | 158.8 | W | W | W | W | W | W | W | W |
| 2014 | W | W | 171.4 | 127.5 | 99.7 | 102.9 | 102.0 | 104.3 | 93.1 | 98.8 | 99.7 | 118.9 |
| 2015 | 107.1 | 83.6 | 95.5 | 101.0 | 98.6 | 110.4 | 115.9 | 111.2 | 108.4 | 110.8 | 105.6 | 103.1 |
| 2016 | 91.7 | 102.3 | 118.9 | 119.2 | 127.6 | 120.8 | 99.2 | 95.8 | 89.2 | 84.6 | 69.9 | W |
| 2017 | W | W | W | W | W | W | W | W | W | W | W | W |
| 2018 | W | W | W | W | W | W | W | W | W | W | W | W |
| 2019 | W | W | W | W | W | W | W | W | 237.7 | 234.2 | 230.3 | 233.9 |
| 2020 | 215.0 | 215.2 | 189.2 | 114.2 | 165.1 | 218.7 | 221.6 | 213.1 | 214.4 | 216.4 | 77.0 | 73.3 |
| 2021 | 53.5 | W | 134.3 | 215.4 | 440.4 | 821.2 | 877.0 | 723.6 | 669.8 | 630.1 | 581.9 | 641.4 |
| 2022 | 541.2 | W | W | |||||||||
| - = No Data Reported; -- = Not Applicable; NA = Not Available; W = Withheld to avoid disclosure of individual company data. |
| Release Date: 6/1/2022 |
| Next Release Date: TBD |