|
Download Data (XLS File) |
|
||||||||
|
||||||||
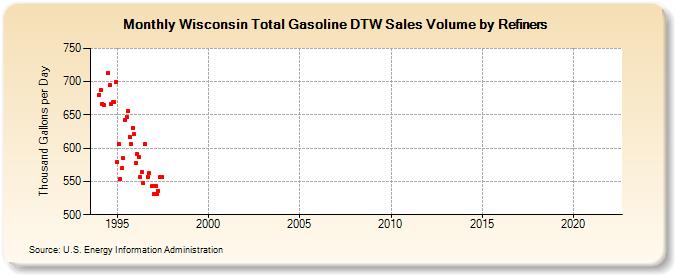
| Wisconsin Total Gasoline DTW Sales Volume by Refiners (Thousand Gallons per Day) | ||||||||
| Year | Jan | Feb | Mar | Apr | May | Jun | Jul | Aug | Sep | Oct | Nov | Dec |
|---|---|---|---|---|---|---|---|---|---|---|---|---|
| 1994 | 680.4 | 687.2 | 667.1 | 665.5 | W | W | 713.0 | 694.4 | 666.5 | 668.9 | 669.6 | 699.5 |
| 1995 | 578.8 | 606.6 | 553.8 | 569.9 | 584.8 | 642.2 | 646.9 | 655.5 | 617.3 | 605.6 | 629.7 | 621.2 |
| 1996 | 577.1 | 591.0 | 586.5 | 556.7 | 564.5 | 547.7 | 606.1 | W | 556.6 | 562.1 | W | 543.5 |
| 1997 | 531.1 | 543.8 | 530.5 | 536.2 | 556.9 | 556.1 | W | W | W | W | W | W |
| 1998 | W | W | W | NA | W | W | W | W | W | W | W | W |
| 1999 | W | W | W | W | W | W | W | W | W | W | W | W |
| 2000 | W | W | W | W | W | W | W | W | W | W | W | W |
| 2001 | W | W | W | W | W | W | W | W | W | W | W | W |
| 2002 | W | W | W | W | W | W | W | W | W | W | W | W |
| 2003 | W | W | W | W | W | W | W | W | W | W | W | W |
| 2004 | W | W | W | W | W | W | W | - | - | - | - | - |
| 2005 | W | - | - | - | - | - | - | - | - | - | - | - |
| 2006 | W | - | W | W | W | W | W | W | W | - | - | - |
| 2007 | - | - | - | - | - | - | - | - | - | - | - | - |
| 2008 | - | - | - | - | - | - | - | W | - | W | W | W |
| 2009 | W | W | W | W | NA | - | - | - | - | - | - | - |
| 2010 | - | - | - | - | - | - | - | - | - | - | - | - |
| 2011 | - | - | - | - | - | - | - | - | - | - | - | - |
| 2012 | - | - | - | - | - | - | - | - | - | - | - | - |
| 2013 | - | - | - | - | - | - | - | - | - | - | - | - |
| 2014 | - | - | - | - | - | - | - | - | - | - | - | - |
| 2015 | - | - | - | - | - | - | - | - | - | - | W | W |
| 2016 | W | W | W | W | W | W | W | W | W | W | W | W |
| 2017 | W | W | W | W | W | W | W | W | W | W | W | W |
| 2018 | W | W | W | NA | - | - | - | - | - | - | - | - |
| 2019 | - | - | - | - | - | - | - | - | - | - | - | - |
| 2020 | - | - | - | - | - | - | - | - | - | - | - | - |
| 2021 | - | - | - | - | - | - | - | - | - | - | - | - |
| 2022 | - | - | - | |||||||||
| - = No Data Reported; -- = Not Applicable; NA = Not Available; W = Withheld to avoid disclosure of individual company data. |
| Release Date: 6/1/2022 |
| Next Release Date: TBD |