|
Download Data (XLS File) |
|
||||||||
|
||||||||
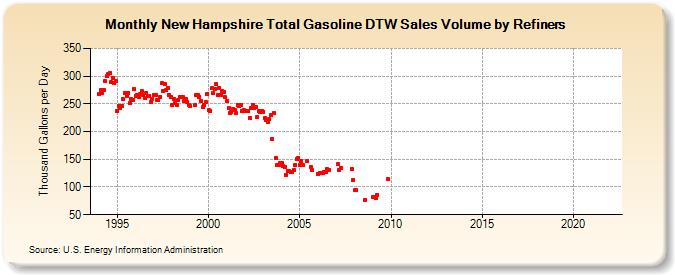
| New Hampshire Total Gasoline DTW Sales Volume by Refiners (Thousand Gallons per Day) | ||||||||
| Year | Jan | Feb | Mar | Apr | May | Jun | Jul | Aug | Sep | Oct | Nov | Dec |
|---|---|---|---|---|---|---|---|---|---|---|---|---|
| 1994 | 268.0 | 274.4 | 269.4 | 275.7 | 290.8 | 299.7 | 304.7 | 305.8 | 288.7 | 296.7 | 287.1 | 290.4 |
| 1995 | 237.4 | 245.8 | 242.2 | 246.3 | 258.1 | 269.6 | 264.0 | 269.9 | 250.6 | 258.5 | 256.6 | 276.9 |
| 1996 | 264.3 | 265.9 | 262.1 | 268.3 | 272.4 | 266.1 | 260.6 | 270.1 | 264.7 | 264.7 | 252.5 | 258.3 |
| 1997 | 266.5 | 266.2 | 257.4 | 257.3 | 262.5 | 286.8 | 273.2 | 285.7 | 274.3 | 277.7 | 265.6 | 263.0 |
| 1998 | 247.7 | 259.3 | 251.0 | 248.3 | 256.6 | 262.4 | 261.5 | 262.7 | 255.1 | 258.7 | 253.5 | 248.3 |
| 1999 | 246.0 | W | W | 248.3 | 265.9 | 265.4 | 262.9 | 255.7 | 243.9 | 248.4 | 253.2 | 267.2 |
| 2000 | 239.2 | 237.0 | 278.0 | 268.9 | 276.9 | 285.8 | 266.5 | 278.8 | 266.5 | 272.7 | 272.0 | 261.6 |
| 2001 | 256.0 | 242.4 | 233.4 | 234.7 | 240.9 | 239.2 | 233.1 | 247.5 | 245.3 | 247.1 | 237.6 | 238.5 |
| 2002 | 237.2 | 237.3 | 237.7 | 225.2 | 242.5 | 248.6 | 242.5 | 244.8 | 225.8 | 236.6 | 234.7 | 237.9 |
| 2003 | 236.1 | 224.7 | 221.2 | 218.1 | 222.1 | 229.0 | 185.7 | 233.1 | 153.1 | 139.5 | 139.4 | 143.2 |
| 2004 | 144.1 | 138.1 | 135.5 | 122.5 | 129.0 | 129.4 | 127.4 | 126.5 | 130.9 | 139.7 | 150.3 | 152.5 |
| 2005 | 139.8 | 147.4 | 139.5 | W | W | 147.7 | W | 135.8 | 130.5 | W | W | W |
| 2006 | 124.2 | 125.0 | W | 125.8 | 126.5 | 127.4 | 132.3 | 131.1 | W | W | W | W |
| 2007 | W | 141.3 | 130.3 | 135.1 | W | W | W | W | W | W | 133.2 | 112.0 |
| 2008 | 94.3 | 94.5 | W | W | W | W | W | 77.4 | W | W | W | W |
| 2009 | 81.9 | 82.4 | 80.8 | 86.2 | W | W | W | W | W | W | 115.1 | W |
| 2010 | W | W | W | W | W | W | W | W | W | W | W | W |
| 2011 | W | W | W | W | W | W | W | W | W | W | W | W |
| 2012 | W | W | W | W | W | W | W | W | W | - | - | - |
| 2013 | - | - | - | - | - | - | - | - | - | - | - | - |
| 2014 | - | - | - | - | - | - | - | - | - | - | - | - |
| 2015 | - | - | - | - | - | - | - | - | - | - | - | - |
| 2016 | - | - | - | - | - | W | W | W | W | W | W | W |
| 2017 | W | W | W | W | W | W | W | W | W | W | W | W |
| 2018 | W | W | W | W | W | W | W | W | W | W | W | W |
| 2019 | W | W | W | W | W | W | W | W | W | W | W | W |
| 2020 | W | W | W | W | W | W | W | W | W | W | W | W |
| 2021 | W | W | W | W | W | W | W | W | W | W | W | W |
| 2022 | W | W | W | |||||||||
| - = No Data Reported; -- = Not Applicable; NA = Not Available; W = Withheld to avoid disclosure of individual company data. |
| Release Date: 6/1/2022 |
| Next Release Date: TBD |