|
Download Data (XLS File) |
|
||||||||
|
||||||||
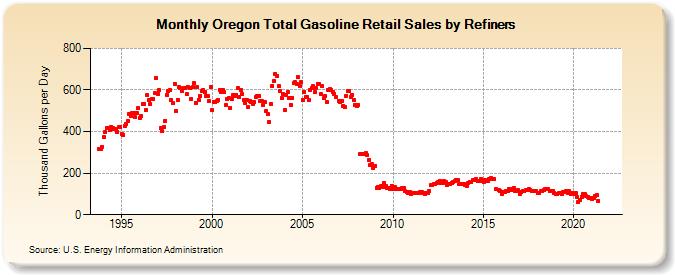
| Oregon Total Gasoline Retail Sales by Refiners (Thousand Gallons per Day) | ||||||||
| Year | Jan | Feb | Mar | Apr | May | Jun | Jul | Aug | Sep | Oct | Nov | Dec |
|---|---|---|---|---|---|---|---|---|---|---|---|---|
| 1993 | 316.7 | 315.4 | 327.9 | |||||||||
| 1994 | 373.0 | 397.6 | 417.7 | 415.4 | 405.1 | 422.6 | 417.4 | 414.2 | 411.1 | 398.3 | 421.6 | 421.3 |
| 1995 | 388.3 | 384.4 | 427.3 | 438.1 | 449.8 | 486.2 | 474.1 | 487.2 | 489.6 | 469.6 | 489.8 | 512.7 |
| 1996 | 464.1 | 472.6 | 532.8 | 532.6 | 503.5 | 576.8 | 550.5 | 530.8 | 558.2 | 557.8 | 584.8 | 656.4 |
| 1997 | 582.5 | 598.5 | 418.4 | 401.2 | 420.3 | 452.1 | 578.1 | 594.9 | 597.5 | 552.3 | 537.8 | 630.4 |
| 1998 | 498.2 | 553.7 | 613.6 | 610.5 | 596.0 | 609.6 | 611.5 | 579.1 | 616.2 | 610.5 | 558.1 | 612.3 |
| 1999 | 632.1 | 539.2 | 612.5 | 553.0 | 571.6 | 597.2 | 602.1 | 592.1 | 570.0 | 570.9 | 546.5 | 614.4 |
| 2000 | 501.8 | 542.8 | 540.5 | 546.2 | 552.3 | 599.3 | 591.1 | 599.9 | 587.9 | 526.8 | 558.2 | 560.1 |
| 2001 | 514.8 | 554.6 | 575.0 | 572.6 | 577.8 | 607.3 | 566.9 | 601.3 | 581.6 | 552.6 | 538.3 | 554.1 |
| 2002 | 517.0 | 545.0 | 543.1 | 534.0 | 541.3 | 564.8 | 571.4 | 572.5 | 545.9 | 547.1 | 529.1 | 540.5 |
| 2003 | 497.1 | 483.8 | 446.1 | 534.4 | 620.6 | 643.9 | 677.5 | 668.6 | 617.2 | 596.4 | 560.5 | 580.6 |
| 2004 | 502.5 | 577.1 | 587.9 | 561.2 | 529.1 | 563.5 | 632.4 | 637.0 | 630.0 | 662.5 | 618.9 | 636.5 |
| 2005 | 552.3 | 591.6 | 566.1 | 565.8 | 552.7 | 601.3 | 610.8 | 617.4 | 588.1 | 608.8 | 629.6 | 629.8 |
| 2006 | 579.4 | 617.6 | 559.7 | 570.8 | 541.8 | 601.4 | 603.9 | 601.8 | 591.9 | 582.7 | 565.6 | NA |
| 2007 | 547.0 | 542.9 | 546.0 | 525.3 | 515.8 | 571.0 | 593.0 | 597.3 | 568.0 | 577.4 | 550.6 | 529.4 |
| 2008 | 520.8 | 526.8 | 291.6 | 292.2 | 292.3 | 290.1 | 296.5 | 285.9 | 265.0 | 238.2 | 242.2 | 225.3 |
| 2009 | 235.8 | 129.6 | 134.6 | 129.8 | 137.4 | 135.2 | 150.4 | 137.7 | 129.1 | 128.1 | 124.7 | 139.4 |
| 2010 | 121.5 | 131.6 | 121.6 | 125.4 | 124.1 | 125.4 | 126.8 | 126.1 | 112.0 | 109.6 | 105.5 | 109.8 |
| 2011 | 99.6 | 106.1 | 104.2 | 105.2 | 103.0 | 106.6 | 108.4 | 107.5 | 103.4 | 101.5 | 103.4 | 104.7 |
| 2012 | 113.6 | 141.2 | 141.7 | 146.9 | 149.5 | 152.4 | 158.0 | 163.5 | 150.3 | 152.2 | 161.3 | 156.1 |
| 2013 | 141.8 | 148.8 | 150.1 | 154.6 | 155.1 | 160.6 | 168.3 | 165.9 | 145.8 | 146.6 | 150.1 | 149.0 |
| 2014 | 141.3 | 138.6 | 151.4 | 158.4 | 157.9 | 166.1 | 166.1 | 171.7 | 161.3 | 163.6 | 170.6 | 163.0 |
| 2015 | 158.4 | 167.5 | 160.7 | 164.5 | 172.0 | 174.5 | 174.1 | 169.5 | 122.3 | NA | 116.6 | 115.5 |
| 2016 | 101.7 | 109.2 | 107.9 | 116.4 | 113.1 | 123.3 | 118.9 | 122.2 | 128.5 | 116.2 | 112.4 | 118.1 |
| 2017 | 98.1 | 110.1 | 111.8 | 112.4 | 118.1 | 120.8 | 124.5 | 120.9 | 113.9 | 115.3 | 113.1 | 113.5 |
| 2018 | 105.7 | 102.9 | 111.9 | 114.8 | 117.1 | 122.4 | 124.2 | 121.5 | 115.9 | 115.0 | 113.7 | 105.9 |
| 2019 | 97.7 | 99.7 | 104.3 | 103.8 | 101.4 | 110.2 | 110.7 | 112.2 | 106.1 | 112.4 | 98.3 | 105.8 |
| 2020 | 100.1 | 106.0 | 84.6 | 58.9 | 70.7 | 87.0 | 98.1 | 98.1 | 88.2 | 86.2 | 78.5 | 80.5 |
| 2021 | 77.2 | 80.9 | 89.8 | 94.5 | 68.2 | W | W | W | W | W | W | W |
| 2022 | W | W | W | |||||||||
| - = No Data Reported; -- = Not Applicable; NA = Not Available; W = Withheld to avoid disclosure of individual company data. |
| Release Date: 6/1/2022 |
| Next Release Date: TBD |