|
Download Data (XLS File) |
|
||||||||
|
||||||||
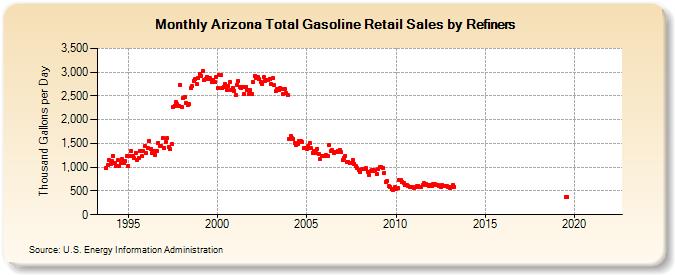
| Arizona Total Gasoline Retail Sales by Refiners (Thousand Gallons per Day) | ||||||||
| Year | Jan | Feb | Mar | Apr | May | Jun | Jul | Aug | Sep | Oct | Nov | Dec |
|---|---|---|---|---|---|---|---|---|---|---|---|---|
| 1993 | 973.9 | 1,037.4 | 1,147.1 | |||||||||
| 1994 | 1,073.6 | 1,130.0 | 1,230.6 | 1,081.2 | 1,021.5 | 1,144.2 | 1,034.8 | 1,081.6 | 1,162.2 | 1,092.4 | 1,119.9 | 1,245.0 |
| 1995 | 1,032.7 | 1,232.8 | 1,340.8 | 1,228.9 | 1,187.4 | 1,308.1 | 1,160.7 | 1,203.3 | 1,337.4 | 1,231.7 | 1,342.6 | 1,439.2 |
| 1996 | 1,290.1 | 1,396.7 | 1,556.4 | 1,383.9 | 1,293.0 | 1,338.3 | 1,256.4 | 1,346.0 | 1,512.2 | 1,442.5 | 1,446.9 | 1,619.5 |
| 1997 | 1,405.5 | 1,528.8 | 1,605.0 | 1,427.0 | 1,374.9 | 1,484.7 | 2,257.4 | 2,295.8 | 2,371.1 | 2,319.4 | 2,294.2 | 2,735.6 |
| 1998 | 2,257.0 | 2,457.8 | 2,479.1 | 2,360.4 | 2,313.7 | 2,332.6 | 2,668.8 | 2,699.6 | 2,821.6 | 2,846.0 | 2,745.4 | 2,870.7 |
| 1999 | 2,966.6 | 2,925.0 | 3,029.0 | 2,824.5 | 2,862.5 | 2,898.6 | 2,850.7 | 2,872.4 | 2,803.1 | 2,830.5 | 2,786.7 | 2,896.7 |
| 2000 | 2,661.7 | 2,931.2 | 2,930.7 | 2,674.5 | 2,693.5 | 2,743.3 | 2,630.0 | 2,711.2 | 2,787.9 | 2,634.4 | 2,673.3 | 2,600.6 |
| 2001 | 2,514.3 | 2,739.6 | 2,818.2 | 2,677.7 | 2,660.7 | 2,694.4 | 2,550.5 | 2,690.8 | 2,630.9 | 2,548.9 | 2,622.6 | 2,541.7 |
| 2002 | 2,786.9 | 2,924.5 | 2,885.0 | 2,892.2 | 2,846.0 | 2,803.0 | 2,756.0 | 2,895.6 | 2,809.2 | 2,844.8 | 2,834.3 | 2,862.6 |
| 2003 | 2,747.7 | 2,871.3 | 2,723.1 | 2,598.0 | 2,643.4 | 2,632.4 | 2,657.5 | 2,653.8 | 2,539.1 | 2,645.1 | 2,557.5 | 2,517.5 |
| 2004 | 1,602.6 | 1,659.5 | 1,607.9 | 1,589.4 | 1,518.5 | 1,471.9 | 1,497.8 | 1,551.8 | 1,542.2 | 1,520.1 | 1,413.5 | 1,414.0 |
| 2005 | 1,382.1 | 1,447.4 | 1,506.3 | 1,395.8 | 1,307.8 | 1,346.0 | 1,304.1 | 1,391.3 | 1,273.2 | 1,175.1 | 1,235.9 | 1,228.0 |
| 2006 | 1,238.3 | 1,251.6 | 1,238.8 | 1,470.7 | 1,340.2 | 1,355.2 | 1,301.9 | 1,313.5 | 1,314.6 | 1,336.7 | 1,367.4 | 1,313.3 |
| 2007 | 1,146.8 | 1,197.5 | 1,242.0 | 1,098.8 | 1,114.8 | 1,088.3 | 1,091.7 | 1,142.5 | 1,073.3 | 1,015.9 | 973.1 | 940.4 |
| 2008 | 905.2 | 961.0 | 970.3 | 954.9 | 976.3 | 907.7 | 829.8 | 915.1 | 945.3 | 943.9 | 916.6 | 853.7 |
| 2009 | 956.5 | 1,000.4 | 1,000.1 | 977.7 | 880.9 | 690.5 | 711.5 | 596.8 | 583.7 | 546.4 | 529.9 | 577.2 |
| 2010 | 534.8 | 567.3 | 732.8 | 733.3 | 692.8 | 670.9 | 621.7 | 617.4 | 605.6 | 593.4 | 584.7 | 586.7 |
| 2011 | 568.7 | 573.4 | 596.0 | 608.4 | 579.4 | 582.4 | 629.1 | 657.3 | 656.0 | 634.4 | 614.3 | 627.2 |
| 2012 | 604.4 | 637.9 | 637.2 | 616.9 | 622.1 | 598.2 | 586.2 | 620.0 | 599.3 | 605.0 | 593.8 | 574.7 |
| 2013 | 559.1 | 591.0 | 617.3 | 589.8 | W | W | W | W | W | W | W | W |
| 2014 | W | W | W | W | W | W | W | W | W | W | W | W |
| 2015 | W | W | W | W | W | W | W | W | W | W | W | W |
| 2016 | W | W | W | W | W | W | W | W | W | W | W | W |
| 2017 | W | W | W | W | W | W | W | W | W | W | W | W |
| 2018 | W | W | W | W | W | W | W | W | W | W | W | W |
| 2019 | W | W | W | W | W | W | 366.5 | 364.8 | W | W | W | W |
| 2020 | W | W | W | W | W | W | W | W | W | W | W | W |
| 2021 | W | W | W | W | W | W | W | W | W | W | W | W |
| 2022 | NA | W | W | |||||||||
| - = No Data Reported; -- = Not Applicable; NA = Not Available; W = Withheld to avoid disclosure of individual company data. |
| Release Date: 6/1/2022 |
| Next Release Date: TBD |