|
Download Data (XLS File) |
|
||||||||
|
||||||||
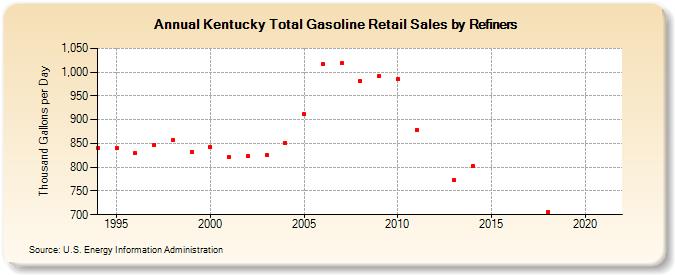
| Kentucky Total Gasoline Retail Sales by Refiners (Thousand Gallons per Day) | ||||||||
| Decade | Year-0 | Year-1 | Year-2 | Year-3 | Year-4 | Year-5 | Year-6 | Year-7 | Year-8 | Year-9 |
|---|---|---|---|---|---|---|---|---|---|---|
| 1990's | 840.7 | 840.5 | 829.5 | 847.3 | 856.3 | 832.1 | ||||
| 2000's | 842.6 | 820.5 | 823.2 | 825.9 | 851.0 | 911.2 | 1,016.3 | 1,018.7 | 980.5 | 992.0 |
| 2010's | 985.9 | 879.0 | W | 772.6 | 802.0 | W | W | W | 704.7 | W |
| 2020's | W |
| - = No Data Reported; -- = Not Applicable; NA = Not Available; W = Withheld to avoid disclosure of individual company data. |
| Release Date: 6/1/2022 |
| Next Release Date: TBD |