|
Download Data (XLS File) |
|
||||||||
|
||||||||
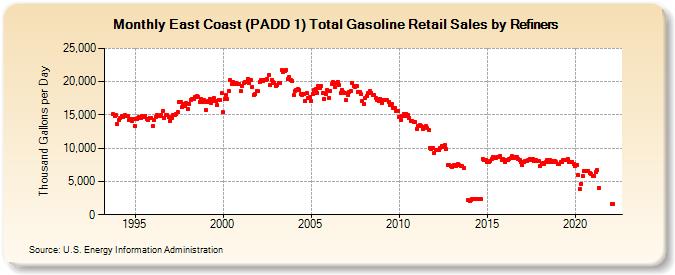
| East Coast (PADD 1) Total Gasoline Retail Sales by Refiners (Thousand Gallons per Day) | ||||||||
| Year | Jan | Feb | Mar | Apr | May | Jun | Jul | Aug | Sep | Oct | Nov | Dec |
|---|---|---|---|---|---|---|---|---|---|---|---|---|
| 1993 | 15,079.4 | 14,879.8 | 15,002.3 | |||||||||
| 1994 | 13,593.4 | 14,291.6 | 14,587.8 | 14,776.9 | 14,680.7 | 14,974.3 | 14,854.5 | 14,851.6 | 14,180.0 | 14,314.7 | 14,134.3 | 14,444.9 |
| 1995 | 13,309.5 | 14,329.5 | 14,469.6 | 14,721.6 | 14,568.3 | 14,766.5 | 14,648.2 | 14,834.1 | 14,384.4 | 14,305.8 | 14,560.1 | 14,608.0 |
| 1996 | 13,377.3 | 14,209.5 | 14,664.4 | 15,062.0 | 14,820.9 | 14,813.4 | 15,017.2 | 15,604.6 | 14,603.2 | 14,930.3 | 14,953.1 | 14,664.5 |
| 1997 | 14,120.7 | 14,525.5 | 14,949.3 | 15,047.1 | 15,091.0 | 15,397.9 | 16,898.6 | 16,947.6 | 16,206.7 | 16,675.5 | 16,308.2 | 16,774.5 |
| 1998 | 15,909.9 | 16,677.9 | 17,233.5 | 17,327.6 | 17,374.7 | 17,722.2 | 17,873.5 | 17,734.0 | 16,952.7 | 17,387.0 | 16,950.7 | 17,213.1 |
| 1999 | 15,766.5 | 16,887.4 | 17,134.6 | 17,465.2 | 16,818.1 | 17,052.5 | 17,478.9 | 17,111.7 | 16,432.1 | 17,275.8 | 17,279.5 | 18,235.7 |
| 2000 | 15,389.4 | 17,322.0 | 18,010.6 | 17,357.2 | 18,564.6 | 20,241.3 | 19,575.4 | 19,973.4 | 19,621.9 | 19,829.2 | 19,698.1 | 19,695.1 |
| 2001 | 18,531.4 | 19,419.8 | 19,797.5 | 19,978.2 | 19,967.5 | 20,447.7 | 19,810.8 | 20,184.6 | 19,268.3 | 18,049.8 | 18,076.9 | 18,608.1 |
| 2002 | 18,532.3 | 19,963.7 | 20,251.0 | 20,117.0 | 20,211.6 | 20,222.3 | 20,428.5 | 21,022.5 | 19,429.3 | 20,258.0 | 19,914.2 | 19,858.7 |
| 2003 | 19,310.3 | 19,464.3 | 19,782.0 | 19,862.6 | 21,691.5 | 21,461.5 | 21,624.8 | 21,808.8 | 20,327.7 | 20,648.2 | 20,239.2 | 20,126.6 |
| 2004 | 17,953.3 | 18,532.5 | 18,763.5 | 18,878.1 | 18,718.0 | 18,140.7 | 17,959.3 | 18,200.1 | 17,119.6 | 18,225.5 | 17,563.7 | 17,691.2 |
| 2005 | 17,058.5 | 18,073.5 | 18,674.1 | 18,862.0 | 18,359.4 | 19,272.9 | 19,111.7 | 19,380.2 | 18,351.1 | 17,458.3 | 18,132.8 | 18,759.8 |
| 2006 | 17,590.0 | 18,596.4 | 19,602.2 | 19,940.3 | 19,139.3 | 19,857.3 | 20,013.5 | 19,475.4 | 18,343.7 | 18,819.3 | 18,432.3 | 18,278.5 |
| 2007 | 17,172.6 | 17,994.6 | 18,373.5 | 18,595.7 | 19,820.0 | 19,374.3 | 19,149.8 | 19,403.7 | 18,517.4 | 18,509.1 | 18,101.0 | 17,028.5 |
| 2008 | 16,672.3 | 17,521.4 | 17,872.0 | 18,246.1 | 18,526.3 | 18,352.9 | 17,980.4 | 18,009.6 | 17,618.0 | 17,204.0 | 17,115.7 | 17,459.6 |
| 2009 | 16,770.7 | 17,199.9 | 17,217.2 | 17,171.4 | 17,239.6 | 17,006.3 | 16,465.6 | 16,665.9 | 16,009.7 | 16,069.6 | 15,546.8 | 15,570.5 |
| 2010 | 14,721.1 | 14,232.5 | 14,880.4 | 15,204.4 | 14,861.1 | 15,190.3 | 14,919.2 | 14,554.6 | 14,103.4 | 14,112.8 | 13,882.2 | 13,898.7 |
| 2011 | 12,927.9 | 13,347.5 | 13,449.5 | 13,345.0 | 12,879.9 | 13,254.6 | 13,276.8 | 12,997.4 | 12,804.7 | 10,034.5 | 9,914.5 | 10,026.2 |
| 2012 | 9,227.2 | 9,664.6 | 9,798.7 | 9,797.9 | 10,036.2 | 10,384.5 | 10,236.9 | 10,463.9 | 9,824.6 | 7,484.4 | 7,422.2 | 7,337.5 |
| 2013 | 7,161.3 | 7,418.1 | 7,420.5 | 7,388.3 | 7,633.2 | 7,424.0 | 7,266.3 | 7,278.4 | 6,959.7 | NA | NA | 2,172.5 |
| 2014 | 2,115.7 | 2,207.9 | 2,319.4 | 2,368.6 | 2,364.5 | 2,384.5 | 2,340.1 | 2,366.5 | 2,317.7 | 8,419.8 | 8,242.5 | 8,182.0 |
| 2015 | 7,944.5 | 7,959.3 | 8,100.0 | 8,403.3 | 8,658.1 | 8,459.5 | 8,530.3 | 8,623.1 | 8,620.4 | 8,828.9 | 8,296.9 | 8,410.0 |
| 2016 | 7,963.2 | 8,172.7 | 8,215.0 | 8,427.2 | 8,477.9 | 8,783.9 | 8,591.8 | 8,633.4 | 8,603.0 | 8,440.7 | 8,161.0 | 7,977.7 |
| 2017 | 7,456.0 | 7,897.9 | 8,080.0 | 8,054.2 | 8,164.4 | 8,423.7 | 8,198.5 | 8,330.1 | 8,113.1 | 8,287.1 | 8,118.5 | 8,123.5 |
| 2018 | 7,265.1 | 7,571.0 | 7,730.7 | 7,676.8 | 7,879.9 | 8,222.6 | 7,965.1 | 8,190.7 | 7,873.6 | 8,027.8 | 8,049.8 | 7,876.7 |
| 2019 | 7,642.0 | 7,696.2 | 7,894.3 | 7,860.6 | 8,170.3 | 8,169.8 | 8,167.0 | 8,416.3 | 7,951.4 | 7,992.5 | 7,968.4 | 7,687.3 |
| 2020 | 7,389.6 | 7,530.7 | 5,967.1 | 3,845.3 | 4,688.1 | 5,836.8 | 6,554.1 | 6,631.9 | 6,498.2 | 6,601.0 | 6,242.0 | 6,096.4 |
| 2021 | 5,869.5 | 5,823.3 | 6,442.6 | 6,711.3 | 4,065.4 | W | W | W | W | W | W | W |
| 2022 | NA | 1,596.4 | 1,586.3 | |||||||||
| - = No Data Reported; -- = Not Applicable; NA = Not Available; W = Withheld to avoid disclosure of individual company data. |
| Release Date: 6/1/2022 |
| Next Release Date: TBD |