|
Download Data (XLS File) |
|
||||||||
|
||||||||
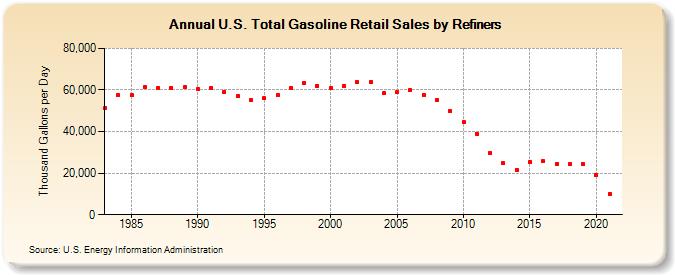
| U.S. Total Gasoline Retail Sales by Refiners (Thousand Gallons per Day) | ||||||||
| Decade | Year-0 | Year-1 | Year-2 | Year-3 | Year-4 | Year-5 | Year-6 | Year-7 | Year-8 | Year-9 |
|---|---|---|---|---|---|---|---|---|---|---|
| 1980's | 51,106.9 | 57,573.4 | 57,536.1 | 61,369.3 | 61,023.5 | 61,029.2 | 61,226.0 | |||
| 1990's | 60,347.9 | 61,180.5 | 59,127.6 | 57,218.8 | 55,033.2 | 55,922.5 | 57,536.0 | 61,123.4 | 63,330.3 | 61,956.0 |
| 2000's | 60,896.9 | 62,013.4 | 63,638.4 | 63,830.5 | 58,388.6 | 58,977.4 | 59,977.8 | 57,653.5 | 55,108.1 | 49,797.6 |
| 2010's | 44,697.0 | 39,002.1 | 29,725.8 | 24,722.5 | 21,633.6 | 25,454.1 | 25,604.5 | 24,498.1 | 24,267.0 | 24,239.3 |
| 2020's | 19,307.7 |
| - = No Data Reported; -- = Not Applicable; NA = Not Available; W = Withheld to avoid disclosure of individual company data. |
| Release Date: 6/1/2022 |
| Next Release Date: TBD |