|
Download Data (XLS File) |
|
||||||||
|
||||||||
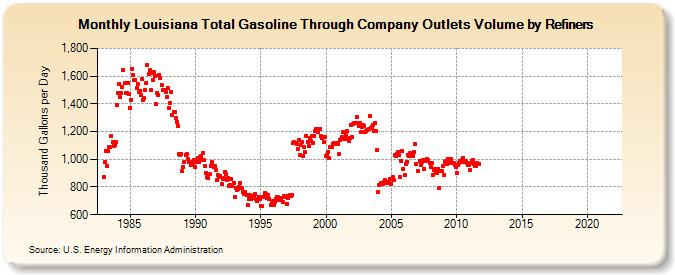
| Louisiana Total Gasoline Through Company Outlets Volume by Refiners (Thousand Gallons per Day) | ||||||||
| Year | Jan | Feb | Mar | Apr | May | Jun | Jul | Aug | Sep | Oct | Nov | Dec |
|---|---|---|---|---|---|---|---|---|---|---|---|---|
| 1983 | 871.6 | 979.9 | 1,062.5 | 952.3 | 1,056.2 | 1,087.8 | 1,085.9 | 1,170.1 | 1,122.7 | 1,097.7 | 1,104.8 | 1,127.1 |
| 1984 | 1,390.9 | 1,481.6 | 1,545.3 | 1,449.9 | 1,478.3 | 1,523.4 | 1,647.1 | 1,549.7 | 1,481.1 | 1,477.2 | 1,552.1 | 1,469.7 |
| 1985 | 1,370.3 | 1,428.2 | 1,652.1 | 1,609.0 | 1,572.2 | 1,574.6 | 1,514.5 | 1,546.3 | 1,482.4 | 1,493.5 | 1,460.8 | 1,576.6 |
| 1986 | 1,428.6 | 1,442.1 | 1,498.6 | 1,550.1 | 1,679.5 | 1,612.2 | 1,641.2 | 1,501.2 | 1,619.0 | 1,573.8 | 1,627.6 | 1,600.1 |
| 1987 | 1,397.7 | 1,479.5 | 1,466.5 | 1,605.4 | 1,586.3 | 1,534.1 | 1,496.6 | 1,497.4 | 1,497.8 | 1,485.3 | 1,450.6 | 1,513.8 |
| 1988 | 1,368.2 | 1,406.2 | 1,488.7 | 1,319.3 | 1,339.7 | 1,341.0 | 1,294.3 | 1,270.4 | 1,240.8 | 1,036.2 | 1,032.9 | 1,038.4 |
| 1989 | 914.2 | 943.7 | 980.9 | 1,030.3 | 1,035.6 | 1,003.2 | 977.4 | 982.5 | 958.9 | 967.8 | 969.6 | 993.8 |
| 1990 | 944.9 | 977.3 | 1,008.5 | 980.4 | 1,014.2 | 1,020.5 | 994.6 | 1,047.3 | 994.2 | 953.1 | 901.3 | 873.6 |
| 1991 | 865.3 | 890.5 | 954.4 | 979.4 | 949.8 | 947.1 | 949.9 | 920.7 | 848.6 | 885.6 | 872.5 | 880.1 |
| 1992 | 820.8 | 859.4 | 866.3 | 911.5 | 892.3 | 851.4 | 868.2 | 809.9 | 817.3 | 858.3 | 806.2 | 829.0 |
| 1993 | 725.5 | 789.9 | 781.4 | 786.3 | 800.6 | 827.7 | 793.1 | 790.0 | 764.9 | 749.4 | 765.7 | 740.3 |
| 1994 | 671.1 | 710.6 | 741.1 | 712.3 | 731.5 | 722.7 | 726.5 | 748.4 | 713.1 | 698.7 | 730.1 | 711.7 |
| 1995 | 663.1 | 663.9 | 726.7 | 731.1 | 754.5 | 747.2 | 719.6 | 742.6 | 714.0 | 666.6 | 683.9 | 696.0 |
| 1996 | 672.7 | 688.8 | 716.7 | 728.0 | 728.0 | 706.3 | 719.9 | 715.1 | 689.0 | 733.6 | 726.0 | 736.4 |
| 1997 | 675.5 | 719.3 | 733.5 | 745.6 | 737.1 | 742.3 | 1,114.8 | 1,124.3 | 1,114.0 | 1,111.5 | 1,073.8 | 1,138.9 |
| 1998 | 1,030.2 | 1,100.1 | 1,126.0 | 1,023.3 | 1,086.5 | 1,051.2 | 1,171.2 | 1,127.0 | 1,094.7 | 1,155.2 | 1,130.7 | 1,170.4 |
| 1999 | 1,116.7 | 1,171.5 | 1,200.9 | 1,218.1 | 1,215.5 | 1,199.6 | 1,221.9 | 1,166.4 | 1,152.1 | 1,158.7 | 1,126.4 | 1,159.4 |
| 2000 | 1,020.4 | 1,032.3 | 1,055.6 | 1,009.4 | 1,088.8 | 1,086.7 | 1,113.8 | 1,116.2 | 1,111.7 | 1,112.5 | 1,114.9 | 1,112.7 |
| 2001 | 1,035.9 | 1,138.0 | 1,147.6 | 1,159.6 | 1,195.9 | 1,147.5 | 1,173.7 | 1,203.1 | 1,147.0 | 1,135.2 | 1,153.6 | 1,248.6 |
| 2002 | 1,158.7 | 1,256.4 | 1,264.2 | 1,261.2 | 1,308.5 | 1,265.2 | 1,240.8 | 1,262.5 | 1,193.5 | 1,229.6 | 1,248.3 | 1,237.7 |
| 2003 | 1,196.4 | 1,207.5 | 1,210.7 | 1,215.3 | 1,311.4 | 1,226.5 | 1,231.1 | 1,248.4 | 1,203.7 | 1,264.0 | 1,202.1 | 1,069.8 |
| 2004 | 764.0 | 816.2 | 829.3 | 831.5 | 821.3 | 834.7 | 852.2 | 835.0 | 829.4 | 834.3 | 834.0 | 860.5 |
| 2005 | 822.4 | 870.4 | 847.4 | 1,031.1 | 1,020.9 | 1,036.0 | 1,056.0 | 1,027.7 | 874.9 | 986.5 | 1,056.7 | 926.7 |
| 2006 | 884.8 | 969.3 | 983.1 | 1,031.1 | 1,023.3 | 1,043.5 | 1,026.0 | 1,031.1 | 1,026.9 | 1,055.9 | 1,108.1 | 968.1 |
| 2007 | 917.1 | NA | 986.3 | 957.6 | 981.7 | 994.0 | 929.5 | 993.6 | 986.9 | 999.5 | 992.6 | 972.4 |
| 2008 | 942.2 | 976.2 | 888.5 | 923.0 | 931.7 | 901.9 | 897.6 | 926.5 | 793.9 | 913.5 | 917.8 | 952.9 |
| 2009 | 888.1 | 979.2 | 988.9 | 968.4 | 1,004.6 | 1,003.9 | 974.5 | 1,000.4 | 976.2 | 973.7 | 961.3 | 941.9 |
| 2010 | 901.2 | 955.5 | 976.6 | 987.0 | 979.4 | 993.6 | 1,011.6 | 980.4 | 988.2 | 976.4 | 956.0 | 956.7 |
| 2011 | 919.6 | 975.1 | 986.5 | 994.1 | 964.0 | 952.3 | 949.1 | 972.9 | 964.5 | W | W | W |
| 2012 | W | W | W | W | W | W | W | W | W | W | W | W |
| 2013 | W | W | W | W | - | - | - | - | - | - | - | - |
| 2014 | - | - | - | - | - | - | - | - | - | - | - | - |
| 2015 | - | - | - | - | - | - | - | - | - | - | - | - |
| 2016 | - | - | - | - | - | - | - | - | - | - | - | - |
| 2017 | - | - | - | - | - | - | - | - | - | - | - | - |
| 2018 | - | - | - | - | - | - | - | - | - | - | - | - |
| 2019 | - | - | - | - | - | - | - | - | - | - | - | - |
| 2020 | - | - | - | - | - | - | - | - | - | - | - | - |
| 2021 | - | - | - | - | - | - | - | - | - | - | - | - |
| 2022 | - | - | - | |||||||||
| - = No Data Reported; -- = Not Applicable; NA = Not Available; W = Withheld to avoid disclosure of individual company data. |
| Release Date: 6/1/2022 |
| Next Release Date: TBD |