|
Download Data (XLS File) |
|
||||||||
|
||||||||
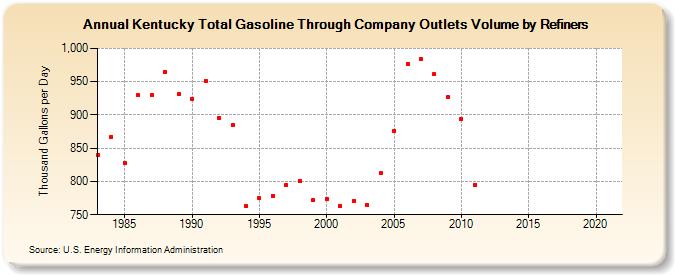
| Kentucky Total Gasoline Through Company Outlets Volume by Refiners (Thousand Gallons per Day) | ||||||||
| Decade | Year-0 | Year-1 | Year-2 | Year-3 | Year-4 | Year-5 | Year-6 | Year-7 | Year-8 | Year-9 |
|---|---|---|---|---|---|---|---|---|---|---|
| 1980's | 839.7 | 867.3 | 827.8 | 929.8 | 929.2 | 965.2 | 931.0 | |||
| 1990's | 924.5 | 951.6 | 895.2 | 884.3 | 763.4 | 774.6 | 778.6 | 794.7 | 801.4 | 771.7 |
| 2000's | 774.3 | 762.8 | 771.3 | 764.8 | 812.3 | 876.3 | 976.6 | 984.8 | 961.0 | 926.4 |
| 2010's | 894.4 | 794.9 | W | W | W | W | W | W | W | W |
| 2020's | W |
| - = No Data Reported; -- = Not Applicable; NA = Not Available; W = Withheld to avoid disclosure of individual company data. |
| Release Date: 6/1/2022 |
| Next Release Date: TBD |