|
Download Data (XLS File) |
|
||||||||
|
||||||||
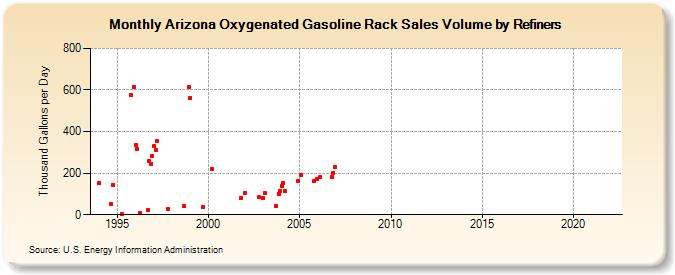
| Arizona Oxygenated Gasoline Rack Sales Volume by Refiners (Thousand Gallons per Day) | ||||||||
| Year | Jan | Feb | Mar | Apr | May | Jun | Jul | Aug | Sep | Oct | Nov | Dec |
|---|---|---|---|---|---|---|---|---|---|---|---|---|
| 1994 | 150.3 | W | W | W | W | W | - | - | 50.7 | 144.9 | W | W |
| 1995 | W | W | W | 1.3 | - | - | - | - | W | 575.3 | W | 616.3 |
| 1996 | 336.0 | 315.1 | W | 7.6 | - | - | - | - | 20.5 | 260.3 | 245.2 | 282.2 |
| 1997 | 329.0 | 311.1 | 353.8 | W | - | - | - | - | W | 28.6 | W | W |
| 1998 | W | W | W | W | - | - | W | W | 41.0 | W | W | 616.6 |
| 1999 | 563.1 | W | W | W | - | NA | - | - | 35.2 | W | W | W |
| 2000 | W | W | 220.4 | - | - | - | - | - | W | W | W | W |
| 2001 | W | W | W | - | - | - | - | - | W | 80.0 | W | W |
| 2002 | 106.2 | W | W | - | - | - | - | - | W | 83.9 | W | W |
| 2003 | 81.4 | 104.2 | W | - | - | - | - | - | 41.3 | W | 99.8 | 111.9 |
| 2004 | 139.8 | 153.6 | 115.5 | W | - | - | - | - | W | W | W | 163.8 |
| 2005 | W | 191.8 | W | W | - | - | - | - | W | 160.5 | W | 172.2 |
| 2006 | W | 180.0 | W | - | - | - | - | - | W | 181.6 | 198.3 | 229.0 |
| 2007 | - | - | - | - | - | - | - | - | - | - | - | - |
| 2008 | - | - | - | - | - | - | - | - | - | - | - | - |
| 2009 | - | - | - | - | - | - | - | - | - | - | - | - |
| 2010 | - | - | - | - | - | - | - | - | - | - | - | - |
| 2011 | - | - | - | - | - | - | - | - | - | - | - | - |
| 2012 | - | - | - | - | - | - | - | - | - | - | - | - |
| 2013 | - | - | - | - | - | - | - | - | - | - | - | - |
| 2014 | - | - | - | - | - | - | - | - | - | - | - | - |
| 2015 | - | - | - | - | - | - | - | - | - | - | - | - |
| 2016 | - | - | - | - | - | - | - | - | - | - | - | - |
| 2017 | - | - | - | - | - | - | - | - | - | - | - | - |
| 2018 | - | - | - | - | - | - | - | - | - | - | - | - |
| 2019 | - | - | - | - | - | - | - | - | - | - | - | - |
| 2020 | - | - | - | - | - | - | - | - | - | - | - | - |
| 2021 | - | - | - | - | - | - | - | - | - | - | - | - |
| 2022 | - | - | - | |||||||||
| - = No Data Reported; -- = Not Applicable; NA = Not Available; W = Withheld to avoid disclosure of individual company data. |
| Release Date: 6/1/2022 |
| Next Release Date: TBD |