|
Download Data (XLS File) |
|
||||||||
|
||||||||
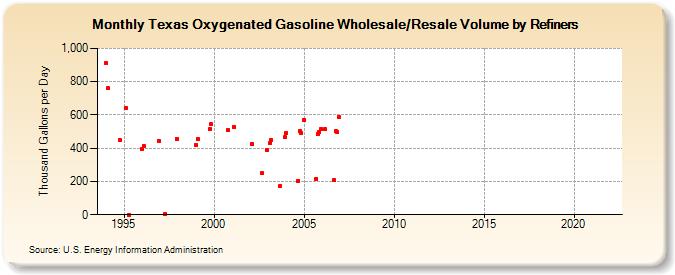
| Texas Oxygenated Gasoline Wholesale/Resale Volume by Refiners (Thousand Gallons per Day) | ||||||||
| Year | Jan | Feb | Mar | Apr | May | Jun | Jul | Aug | Sep | Oct | Nov | Dec |
|---|---|---|---|---|---|---|---|---|---|---|---|---|
| 1994 | 911.1 | 760.3 | W | W | W | W | W | W | W | 450.5 | W | W |
| 1995 | W | 644.2 | W | 0.7 | - | - | - | W | W | W | W | W |
| 1996 | 396.1 | 413.6 | W | W | - | - | - | - | W | W | W | 443.2 |
| 1997 | W | W | W | 3.7 | - | - | - | - | W | W | W | 457.2 |
| 1998 | W | W | W | - | - | - | - | - | W | W | W | W |
| 1999 | 419.5 | 457.0 | W | - | - | - | - | - | W | 515.0 | 542.8 | W |
| 2000 | W | W | W | W | - | - | - | - | W | 506.6 | W | W |
| 2001 | W | 530.0 | W | W | W | - | - | - | W | W | W | W |
| 2002 | W | 425.5 | W | W | - | - | - | - | 248.5 | W | W | 386.3 |
| 2003 | W | 431.0 | 448.4 | W | - | - | - | - | 173.4 | W | W | 465.0 |
| 2004 | 488.7 | W | W | W | - | - | - | - | 204.8 | 504.6 | 491.9 | W |
| 2005 | 570.0 | W | W | - | - | - | - | NA | 216.7 | 487.6 | 495.5 | 512.7 |
| 2006 | W | W | 514.1 | - | - | - | - | - | 207.5 | 501.8 | 495.9 | 585.3 |
| 2007 | - | - | - | - | - | - | - | - | - | - | - | - |
| 2008 | - | - | - | - | - | - | - | - | - | - | - | - |
| 2009 | - | - | - | - | - | - | - | - | - | - | - | - |
| 2010 | - | - | - | - | - | - | - | - | - | - | - | - |
| 2011 | - | - | - | - | - | - | - | - | - | - | - | - |
| 2012 | - | - | - | - | - | - | - | - | - | - | - | - |
| 2013 | - | - | - | - | - | - | - | - | - | - | - | - |
| 2014 | - | - | - | - | - | - | - | - | - | - | - | - |
| 2015 | - | - | - | - | - | - | - | - | - | - | - | - |
| 2016 | - | - | - | - | - | - | - | - | - | - | - | - |
| 2017 | - | - | - | - | - | - | - | - | - | - | - | - |
| 2018 | - | - | - | - | - | - | - | - | - | - | - | - |
| 2019 | - | - | - | - | - | - | - | - | - | - | - | - |
| 2020 | - | - | - | - | - | - | - | - | - | - | - | - |
| 2021 | - | - | - | - | - | - | - | - | - | - | - | - |
| 2022 | - | - | - | |||||||||
| - = No Data Reported; -- = Not Applicable; NA = Not Available; W = Withheld to avoid disclosure of individual company data. |
| Release Date: 6/1/2022 |
| Next Release Date: TBD |