|
Download Data (XLS File) |
|
||||||||
|
||||||||
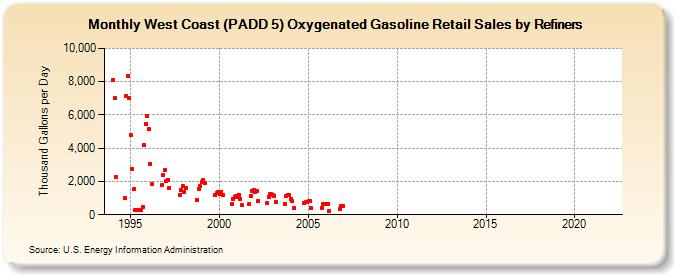
| West Coast (PADD 5) Oxygenated Gasoline Retail Sales by Refiners (Thousand Gallons per Day) | ||||||||
| Year | Jan | Feb | Mar | Apr | May | Jun | Jul | Aug | Sep | Oct | Nov | Dec |
|---|---|---|---|---|---|---|---|---|---|---|---|---|
| 1994 | 8,127.6 | 6,989.3 | 2,290.3 | W | W | W | W | W | 1,004.2 | 7,140.8 | 8,316.2 | 7,009.2 |
| 1995 | 4,776.7 | 2,726.6 | 1,530.9 | 313.2 | 300.8 | 304.1 | 294.9 | 297.5 | 482.1 | 4,182.3 | 5,468.5 | 5,962.3 |
| 1996 | 5,166.0 | 3,069.8 | 1,837.4 | W | W | W | W | W | NA | 1,780.5 | 2,371.2 | 2,716.8 |
| 1997 | 2,002.0 | 2,114.6 | 1,589.0 | W | W | W | W | W | W | 1,195.6 | 1,480.3 | 1,740.8 |
| 1998 | 1,389.0 | 1,631.5 | W | W | W | W | W | W | W | 879.0 | 1,560.8 | 1,720.4 |
| 1999 | 1,965.9 | 2,081.8 | 1,926.1 | W | W | W | W | W | W | 1,161.5 | 1,310.0 | 1,357.2 |
| 2000 | 1,235.5 | 1,387.8 | 1,185.8 | W | W | W | W | W | 618.7 | 954.7 | 1,055.6 | 1,122.7 |
| 2001 | 1,061.6 | 1,207.5 | 934.9 | 559.7 | W | W | W | W | 630.5 | 1,127.9 | 1,443.1 | 1,501.8 |
| 2002 | 1,389.7 | 1,405.9 | 851.7 | W | W | W | W | W | 691.8 | 1,089.7 | 1,218.2 | 1,255.7 |
| 2003 | 1,193.1 | 1,143.3 | 765.6 | W | W | W | W | W | 672.5 | 1,122.9 | 1,199.4 | 1,177.2 |
| 2004 | 927.5 | 806.1 | 409.3 | W | W | W | W | W | NA | 707.6 | 748.8 | 774.4 |
| 2005 | 800.5 | 841.1 | 388.5 | W | W | W | W | W | W | 430.7 | 649.7 | 664.4 |
| 2006 | 652.8 | 672.1 | 228.6 | W | W | W | W | NA | NA | 373.2 | 527.9 | 517.4 |
| 2007 | - | - | - | - | - | - | - | - | - | - | - | - |
| 2008 | - | - | - | - | - | - | - | - | - | - | - | - |
| 2009 | - | - | - | - | - | - | - | - | - | - | - | - |
| 2010 | - | - | - | - | - | - | - | - | - | - | - | - |
| 2011 | - | - | - | - | - | - | - | - | - | - | - | - |
| 2012 | - | - | - | - | - | - | - | - | - | - | - | - |
| 2013 | - | - | - | - | - | - | - | - | - | - | - | - |
| 2014 | - | - | - | - | - | - | - | - | - | - | - | - |
| 2015 | - | - | - | - | - | - | - | - | - | - | - | - |
| 2016 | - | - | - | - | - | - | - | - | - | - | - | - |
| 2017 | - | - | - | - | - | - | - | - | - | - | - | - |
| 2018 | - | - | - | - | - | - | - | - | - | - | - | - |
| 2019 | - | - | - | - | - | - | - | - | - | - | - | - |
| 2020 | - | - | - | - | - | - | - | - | - | - | - | - |
| 2021 | - | - | - | - | - | - | - | - | - | - | - | - |
| 2022 | - | - | - | |||||||||
| - = No Data Reported; -- = Not Applicable; NA = Not Available; W = Withheld to avoid disclosure of individual company data. |
| Release Date: 6/1/2022 |
| Next Release Date: TBD |