|
Download Data (XLS File) |
|
||||||||
|
||||||||
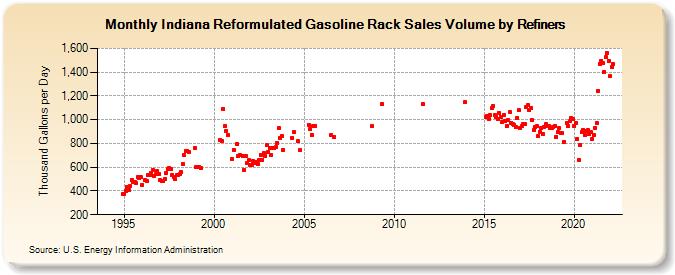
| Indiana Reformulated Gasoline Rack Sales Volume by Refiners (Thousand Gallons per Day) | ||||||||
| Year | Jan | Feb | Mar | Apr | May | Jun | Jul | Aug | Sep | Oct | Nov | Dec |
|---|---|---|---|---|---|---|---|---|---|---|---|---|
| 1994 | - | - | - | - | - | - | - | - | - | - | - | 371.5 |
| 1995 | 370.2 | 398.6 | 430.7 | 406.4 | 442.3 | 494.7 | 473.1 | 472.3 | 464.4 | 513.3 | 511.4 | 516.8 |
| 1996 | 454.0 | W | 493.9 | 480.8 | 531.5 | 531.7 | 547.1 | 574.7 | 528.2 | 539.0 | 565.5 | 542.8 |
| 1997 | 493.3 | 487.9 | 484.7 | 499.6 | 554.1 | 582.6 | 595.1 | 585.2 | 532.0 | 518.5 | 501.4 | 530.5 |
| 1998 | 533.5 | 543.9 | 560.0 | 628.7 | 702.8 | 736.4 | 736.3 | 728.3 | W | W | W | 762.8 |
| 1999 | 599.7 | W | 599.9 | 593.7 | W | W | W | W | W | W | W | W |
| 2000 | W | W | W | W | 826.5 | 822.6 | 1,091.2 | 946.5 | 908.3 | 870.3 | W | W |
| 2001 | 667.9 | 748.6 | W | 794.2 | 694.4 | 705.5 | W | 690.1 | 578.3 | 695.3 | 634.2 | 656.7 |
| 2002 | 620.8 | 620.9 | 651.0 | 635.8 | 645.1 | 628.9 | 663.8 | 705.5 | 663.1 | 720.7 | 698.4 | 784.1 |
| 2003 | 728.9 | 759.1 | 701.1 | 760.3 | 764.3 | 766.4 | 801.7 | 927.2 | 845.9 | 863.7 | 745.5 | W |
| 2004 | W | W | W | W | 843.6 | 894.1 | W | W | 817.0 | 742.3 | W | W |
| 2005 | W | W | W | 958.1 | 919.7 | 871.0 | 942.8 | 947.0 | W | W | W | W |
| 2006 | W | W | W | W | W | W | 873.4 | W | 855.9 | W | W | W |
| 2007 | W | W | W | W | W | W | W | W | W | W | W | W |
| 2008 | W | W | W | W | W | W | W | W | W | 943.5 | W | W |
| 2009 | W | W | W | W | 1,132.8 | W | W | W | W | W | W | W |
| 2010 | W | W | W | W | W | W | W | W | W | W | W | W |
| 2011 | W | W | W | W | W | W | W | 1,131.6 | W | W | W | W |
| 2012 | W | W | W | W | W | W | W | W | W | W | W | W |
| 2013 | W | W | W | W | W | W | W | W | W | W | W | 1,144.9 |
| 2014 | W | W | W | W | W | W | W | W | W | W | W | W |
| 2015 | W | 1,026.6 | 1,030.4 | 1,009.5 | 1,038.1 | 1,096.2 | 1,114.2 | 1,040.9 | 1,026.3 | 1,007.8 | 1,052.0 | 1,025.8 |
| 2016 | 981.9 | 1,035.2 | 990.8 | 944.5 | 997.5 | 1,063.4 | 975.5 | 963.4 | 956.7 | 938.7 | 1,017.2 | 1,078.5 |
| 2017 | 931.6 | 944.8 | 960.7 | 963.3 | 1,103.5 | 1,120.5 | 1,079.3 | 1,099.1 | 998.8 | 912.5 | 934.2 | 943.1 |
| 2018 | 861.6 | 898.6 | 926.5 | 876.4 | 942.3 | 962.9 | 945.8 | 942.8 | 925.9 | 932.9 | 936.3 | 949.7 |
| 2019 | 857.5 | 896.1 | 927.7 | 888.4 | 886.3 | 810.3 | W | 972.4 | 945.1 | 986.7 | 1,013.9 | 1,001.9 |
| 2020 | 950.8 | 973.3 | 835.0 | 662.1 | 788.5 | 895.5 | 916.4 | 872.2 | 902.2 | 912.4 | 875.9 | 892.8 |
| 2021 | 839.5 | 868.8 | 933.0 | 971.9 | 1,243.7 | 1,470.9 | 1,496.8 | 1,479.0 | 1,405.1 | 1,526.6 | 1,562.5 | 1,497.6 |
| 2022 | 1,363.7 | 1,441.5 | 1,466.8 | |||||||||
| - = No Data Reported; -- = Not Applicable; NA = Not Available; W = Withheld to avoid disclosure of individual company data. |
| Release Date: 6/1/2022 |
| Next Release Date: TBD |