|
Download Data (XLS File) |
|
||||||||
|
||||||||
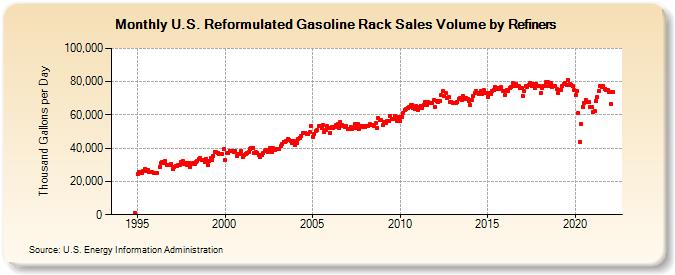
| U.S. Reformulated Gasoline Rack Sales Volume by Refiners (Thousand Gallons per Day) | ||||||||
| Year | Jan | Feb | Mar | Apr | May | Jun | Jul | Aug | Sep | Oct | Nov | Dec |
|---|---|---|---|---|---|---|---|---|---|---|---|---|
| 1994 | - | - | - | - | - | - | - | - | - | - | 1,325.3 | W |
| 1995 | 24,576.5 | 25,695.4 | 25,646.9 | 25,332.3 | 26,460.0 | 27,499.9 | 26,396.1 | 27,173.8 | 25,555.8 | W | 25,675.7 | 25,321.3 |
| 1996 | W | 25,379.7 | W | 28,786.0 | 30,808.2 | 31,981.1 | 31,203.9 | 32,078.1 | 29,694.1 | 29,988.7 | 30,145.9 | 30,539.1 |
| 1997 | 27,465.1 | 28,490.4 | 29,290.9 | 29,320.3 | 29,591.1 | 30,147.5 | 31,964.2 | 32,178.3 | 30,239.9 | 30,890.7 | 29,992.4 | 31,208.3 |
| 1998 | 28,953.3 | 30,294.1 | 31,223.5 | 30,570.8 | 31,469.9 | 32,449.1 | 33,719.2 | 34,195.4 | 32,977.8 | 32,941.8 | 31,896.1 | 33,695.4 |
| 1999 | 29,817.3 | 32,466.3 | 33,806.8 | 33,128.9 | 35,340.3 | 37,715.7 | 37,533.9 | 37,338.6 | 36,746.7 | 36,729.9 | 36,412.6 | 39,483.6 |
| 2000 | 32,740.6 | 37,039.8 | 37,105.3 | 38,407.0 | 38,112.7 | 38,270.9 | 37,795.7 | 38,265.2 | 35,522.4 | 36,280.1 | 36,257.1 | 38,121.6 |
| 2001 | 34,967.4 | 35,974.3 | 36,682.4 | 36,875.0 | 38,002.3 | 39,602.5 | 40,041.7 | 40,341.6 | 37,248.7 | 37,548.6 | 37,218.3 | 36,050.9 |
| 2002 | 34,549.0 | 36,004.3 | 36,892.6 | 38,421.3 | 38,771.2 | 37,750.9 | 38,333.9 | 40,078.0 | 37,502.5 | 39,902.2 | 38,713.2 | 39,292.3 |
| 2003 | 39,582.8 | 39,740.9 | 41,083.1 | 42,223.9 | 43,829.5 | 43,604.6 | 44,235.4 | 45,576.4 | 44,888.2 | 44,345.0 | 42,833.5 | 44,133.6 |
| 2004 | 42,196.1 | 43,236.6 | 45,757.0 | 46,361.4 | 47,113.5 | 48,903.2 | 49,090.0 | 49,402.0 | 48,543.5 | 48,640.3 | 49,951.2 | 53,228.8 |
| 2005 | 46,779.1 | 48,649.0 | 50,143.4 | 51,015.2 | 53,115.5 | 53,043.4 | 51,972.3 | 53,836.4 | 49,692.3 | 50,854.0 | 53,157.0 | 52,341.1 |
| 2006 | 49,152.8 | 52,725.9 | 52,380.5 | 52,883.9 | 54,013.6 | 54,241.4 | 52,206.9 | 55,713.9 | 54,187.6 | 53,634.6 | 52,926.6 | 53,280.8 |
| 2007 | 51,314.8 | 51,746.5 | 52,830.9 | 51,486.5 | 52,306.6 | 54,453.6 | 51,837.5 | 54,277.2 | 51,779.0 | 53,208.8 | 52,560.8 | 53,142.7 |
| 2008 | 52,776.9 | 53,605.4 | 53,598.5 | 54,374.2 | 53,940.4 | 54,224.3 | 53,461.1 | 55,243.7 | 52,309.9 | 57,946.9 | 56,972.2 | 56,882.8 |
| 2009 | 53,695.2 | 55,543.8 | 54,941.2 | 56,175.5 | 56,140.0 | 59,378.1 | 57,617.1 | 57,724.1 | 59,597.5 | 58,220.2 | 56,614.4 | 59,030.0 |
| 2010 | 56,128.2 | 58,794.3 | 61,373.1 | 62,929.2 | 63,487.6 | 64,318.9 | 64,920.0 | 65,921.8 | 65,879.5 | 64,387.3 | 63,685.1 | 65,336.4 |
| 2011 | 63,213.8 | 64,770.7 | 65,557.0 | 64,425.7 | 65,994.5 | 67,814.6 | 66,091.4 | 67,916.5 | 67,430.3 | 67,013.9 | 67,453.8 | 68,879.3 |
| 2012 | 64,591.9 | 68,409.9 | 67,983.0 | 68,210.6 | 71,811.8 | 74,159.4 | 71,340.3 | 73,277.3 | 70,406.0 | 70,500.3 | 67,773.6 | 68,024.8 |
| 2013 | 67,355.2 | 67,093.1 | 67,273.2 | 67,676.6 | 69,794.4 | 70,040.6 | 69,181.2 | 71,116.0 | 69,704.9 | 70,339.3 | 69,457.0 | 68,455.3 |
| 2014 | 65,752.4 | 69,117.8 | 71,149.5 | 72,950.9 | 74,565.6 | 73,445.7 | 72,628.9 | 74,174.0 | 72,661.9 | 74,735.2 | 73,149.5 | 73,456.1 |
| 2015 | 70,978.8 | 72,962.8 | 72,851.5 | 74,514.4 | 74,907.5 | 76,941.4 | 75,636.6 | 76,320.1 | 75,500.8 | 76,496.7 | 74,672.7 | 74,554.3 |
| 2016 | 72,249.7 | 75,121.0 | 74,336.9 | 76,465.1 | 76,955.7 | 79,301.3 | 77,485.9 | 78,619.2 | 77,532.5 | 77,096.3 | 76,221.5 | 76,216.2 |
| 2017 | 71,529.3 | 74,120.1 | 77,118.3 | 77,017.8 | 77,985.7 | 79,466.9 | 77,251.1 | 78,810.4 | 76,215.1 | 78,464.4 | 77,321.2 | 77,297.4 |
| 2018 | 73,072.9 | 76,255.7 | 77,458.5 | 77,563.3 | 79,630.7 | 79,687.6 | 77,226.0 | 79,430.4 | 76,934.3 | 77,547.5 | 77,093.1 | 75,876.2 |
| 2019 | 73,273.5 | 75,282.9 | 75,180.1 | 77,381.6 | 78,378.9 | 79,262.2 | 77,776.7 | 80,763.6 | 78,718.5 | 78,231.6 | 77,365.8 | 74,907.4 |
| 2020 | 72,102.8 | 74,357.4 | 61,087.1 | 43,963.4 | 54,587.4 | 64,763.5 | 67,128.0 | 69,212.6 | 68,021.0 | 67,785.0 | 64,886.6 | 64,498.5 |
| 2021 | 62,028.5 | 62,082.7 | 68,213.4 | 70,757.3 | 74,124.3 | 77,281.2 | 76,940.5 | 77,466.3 | 75,711.6 | 74,969.8 | 74,706.5 | 73,848.9 |
| 2022 | 66,791.4 | 73,916.0 | 73,520.5 | |||||||||
| - = No Data Reported; -- = Not Applicable; NA = Not Available; W = Withheld to avoid disclosure of individual company data. |
| Release Date: 6/1/2022 |
| Next Release Date: TBD |