|
Download Data (XLS File) |
|
||||||||
|
||||||||
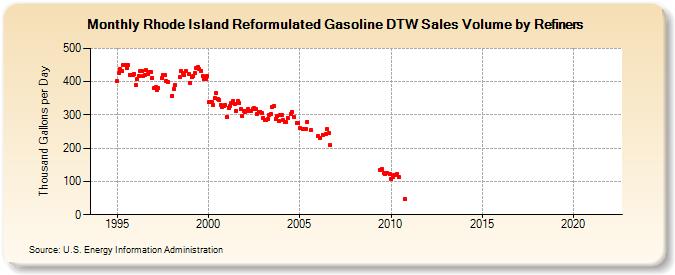
| Rhode Island Reformulated Gasoline DTW Sales Volume by Refiners (Thousand Gallons per Day) | ||||||||
| Year | Jan | Feb | Mar | Apr | May | Jun | Jul | Aug | Sep | Oct | Nov | Dec |
|---|---|---|---|---|---|---|---|---|---|---|---|---|
| 1994 | - | - | - | - | - | - | - | - | - | - | W | W |
| 1995 | 401.4 | 426.3 | 436.7 | 433.0 | 450.7 | 449.6 | 439.9 | 450.1 | 420.9 | 421.0 | 418.6 | 424.5 |
| 1996 | 388.9 | 409.3 | 416.5 | 431.5 | 431.5 | 417.3 | 419.7 | 434.2 | 422.4 | 428.6 | 429.2 | 411.3 |
| 1997 | 381.0 | 382.5 | 375.2 | 382.4 | W | 410.3 | 421.0 | 420.4 | 402.1 | 400.1 | W | W |
| 1998 | 357.7 | 378.3 | 389.5 | W | W | 413.5 | 430.7 | 426.7 | 420.0 | 431.8 | W | 423.7 |
| 1999 | 396.8 | 415.3 | 418.3 | 427.4 | 440.3 | 443.0 | 437.6 | 432.8 | 416.0 | 409.2 | 409.3 | 416.4 |
| 2000 | 338.8 | 337.7 | 337.8 | 330.8 | 351.6 | 366.7 | 346.5 | 345.3 | 330.7 | 324.0 | 327.1 | 329.3 |
| 2001 | 293.8 | 321.8 | 326.5 | 336.1 | 342.1 | 333.4 | 313.1 | 341.8 | 336.1 | 316.7 | 298.2 | 312.1 |
| 2002 | 309.1 | 312.5 | 316.7 | 312.9 | 313.0 | 318.8 | 319.9 | 318.5 | 303.9 | 309.7 | 309.8 | 305.2 |
| 2003 | 291.8 | 285.9 | 285.3 | 287.3 | 299.1 | 302.5 | 324.2 | 327.1 | 288.4 | 297.5 | 281.3 | 300.1 |
| 2004 | 299.3 | 284.7 | 280.1 | 278.6 | 291.8 | W | 303.5 | 308.8 | 293.5 | W | 275.8 | 275.8 |
| 2005 | 259.5 | W | 258.3 | W | 258.2 | 279.7 | W | 253.2 | W | W | W | W |
| 2006 | 236.3 | 231.5 | W | 241.0 | W | 243.6 | 256.2 | 246.0 | 209.8 | W | W | W |
| 2007 | W | W | W | W | W | W | W | W | W | W | W | W |
| 2008 | W | W | W | W | W | W | W | W | W | W | W | W |
| 2009 | W | W | W | W | W | 133.2 | 137.7 | 125.9 | 121.3 | 124.1 | W | 121.5 |
| 2010 | 106.6 | 114.8 | 118.3 | 120.5 | 122.8 | 114.8 | W | W | W | 47.2 | W | W |
| 2011 | W | W | W | W | W | W | W | W | W | W | W | W |
| 2012 | W | W | W | W | W | W | W | W | W | W | W | W |
| 2013 | W | W | W | W | W | W | W | W | W | W | W | W |
| 2014 | W | W | W | W | W | W | W | W | W | W | W | W |
| 2015 | W | W | W | W | W | W | W | W | W | W | W | W |
| 2016 | W | W | W | W | W | W | W | W | W | W | W | W |
| 2017 | W | W | W | W | W | W | W | W | W | - | - | - |
| 2018 | - | - | - | - | - | - | - | - | - | - | - | - |
| 2019 | - | - | - | - | - | - | - | - | - | - | - | - |
| 2020 | - | - | - | - | - | - | - | - | - | - | - | - |
| 2021 | - | - | - | - | - | - | - | - | - | - | - | - |
| 2022 | - | - | - | |||||||||
| - = No Data Reported; -- = Not Applicable; NA = Not Available; W = Withheld to avoid disclosure of individual company data. |
| Release Date: 6/1/2022 |
| Next Release Date: TBD |