|
Download Data (XLS File) |
|
||||||||
|
||||||||
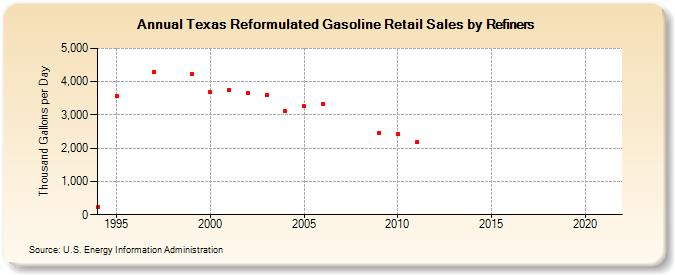
| Texas Reformulated Gasoline Retail Sales by Refiners (Thousand Gallons per Day) | ||||||||
| Decade | Year-0 | Year-1 | Year-2 | Year-3 | Year-4 | Year-5 | Year-6 | Year-7 | Year-8 | Year-9 |
|---|---|---|---|---|---|---|---|---|---|---|
| 1990's | 221.9 | 3,555.1 | W | 4,291.6 | W | 4,242.7 | ||||
| 2000's | 3,675.6 | 3,742.2 | 3,655.5 | 3,592.3 | 3,103.9 | 3,258.1 | 3,341.2 | W | W | 2,470.1 |
| 2010's | 2,432.2 | 2,173.9 | W | W | W | W | W | - | W | W |
| 2020's | W |
| - = No Data Reported; -- = Not Applicable; NA = Not Available; W = Withheld to avoid disclosure of individual company data. |
| Release Date: 6/1/2022 |
| Next Release Date: TBD |