|
Download Data (XLS File) |
|
||||||||
|
||||||||
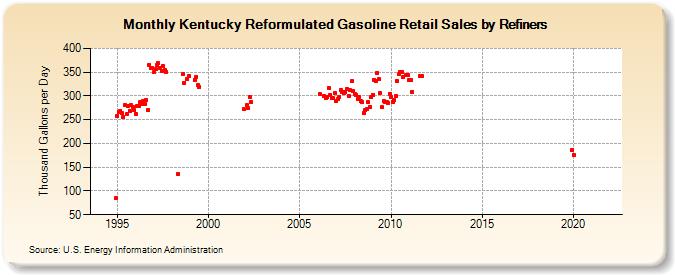
| Kentucky Reformulated Gasoline Retail Sales by Refiners (Thousand Gallons per Day) | ||||||||
| Year | Jan | Feb | Mar | Apr | May | Jun | Jul | Aug | Sep | Oct | Nov | Dec |
|---|---|---|---|---|---|---|---|---|---|---|---|---|
| 1994 | - | - | - | - | - | - | - | - | - | - | - | 84.3 |
| 1995 | 258.7 | 266.1 | 269.2 | 263.3 | 255.7 | 280.3 | 261.8 | 278.1 | 268.8 | 280.5 | 276.2 | 269.9 |
| 1996 | 262.7 | 278.5 | 279.8 | 288.1 | 284.0 | 288.3 | 283.2 | 290.6 | 270.6 | 365.3 | 359.6 | 358.9 |
| 1997 | 349.6 | 355.9 | 365.5 | 368.3 | 358.1 | 352.7 | 362.9 | 355.5 | 350.6 | W | W | W |
| 1998 | W | W | W | W | 136.4 | W | W | 346.2 | 328.1 | W | 334.9 | 341.0 |
| 1999 | W | W | W | 334.1 | 340.1 | 322.5 | 319.7 | W | W | W | W | W |
| 2000 | W | W | W | W | W | W | W | W | W | W | W | W |
| 2001 | W | W | W | W | W | W | W | W | W | W | W | 271.8 |
| 2002 | W | 280.0 | 274.4 | 297.5 | 287.7 | W | W | W | W | W | W | W |
| 2003 | W | W | W | W | W | W | W | W | W | W | W | W |
| 2004 | W | W | W | W | W | W | W | W | W | W | W | W |
| 2005 | W | W | W | W | W | W | W | W | W | W | W | W |
| 2006 | W | 304.3 | W | W | 299.1 | 295.1 | 297.1 | 316.9 | 302.6 | 296.3 | 294.9 | 305.7 |
| 2007 | 289.0 | 294.4 | 298.7 | 311.7 | 309.2 | 305.8 | 308.5 | 315.2 | 299.1 | 311.5 | 330.4 | 310.8 |
| 2008 | 303.0 | 302.1 | 294.1 | 298.3 | 288.3 | 286.3 | 264.4 | 270.2 | 272.1 | 287.1 | 277.4 | 297.7 |
| 2009 | 302.5 | 333.8 | 332.4 | 348.4 | 335.0 | 305.4 | 275.7 | 288.9 | 286.9 | 286.7 | 285.8 | 304.8 |
| 2010 | 298.6 | 287.0 | 290.6 | 300.3 | 331.2 | 345.3 | 349.4 | 351.3 | 339.0 | W | 343.4 | 344.9 |
| 2011 | 333.3 | 334.1 | 308.3 | W | W | W | W | 342.7 | 342.3 | W | W | W |
| 2012 | W | W | W | W | W | W | W | W | W | W | W | W |
| 2013 | W | W | W | W | W | W | W | W | W | W | W | W |
| 2014 | W | W | W | W | W | W | W | W | W | W | W | W |
| 2015 | W | W | W | W | W | W | W | W | W | W | W | W |
| 2016 | W | W | W | W | W | W | W | W | W | W | W | W |
| 2017 | W | W | W | W | W | W | W | W | W | W | W | W |
| 2018 | W | W | W | W | W | W | W | W | W | W | W | W |
| 2019 | W | W | W | W | W | W | W | W | W | W | W | 186.8 |
| 2020 | 176.6 | W | W | W | W | W | W | W | W | W | W | W |
| 2021 | W | W | W | W | W | W | W | W | W | W | W | W |
| 2022 | W | W | W | |||||||||
| - = No Data Reported; -- = Not Applicable; NA = Not Available; W = Withheld to avoid disclosure of individual company data. |
| Release Date: 6/1/2022 |
| Next Release Date: TBD |