|
Download Data (XLS File) |
|
||||||||
|
||||||||
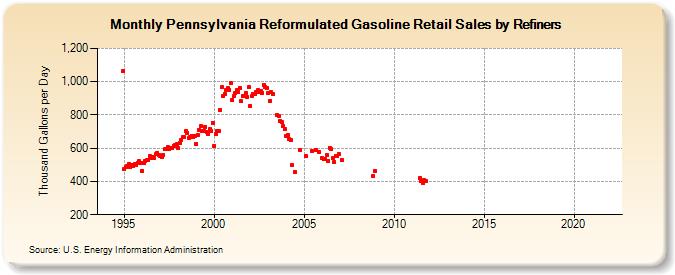
| Pennsylvania Reformulated Gasoline Retail Sales by Refiners (Thousand Gallons per Day) | ||||||||
| Year | Jan | Feb | Mar | Apr | May | Jun | Jul | Aug | Sep | Oct | Nov | Dec |
|---|---|---|---|---|---|---|---|---|---|---|---|---|
| 1994 | - | - | - | - | - | - | - | - | - | - | W | 1,061.9 |
| 1995 | 472.4 | 485.1 | 492.1 | 505.2 | 484.5 | 497.3 | 492.6 | 507.5 | 498.7 | 512.7 | 522.1 | 513.5 |
| 1996 | 462.9 | 511.5 | 524.3 | 527.2 | 531.2 | 551.4 | 539.5 | 545.6 | 541.3 | 562.4 | 571.5 | 561.9 |
| 1997 | 553.6 | 548.4 | 561.5 | 593.0 | 593.2 | 606.9 | 592.7 | 601.8 | 600.4 | 615.1 | 617.9 | 624.3 |
| 1998 | 600.4 | 632.6 | 652.1 | 667.0 | 665.5 | 701.0 | 693.4 | 661.2 | 665.8 | 675.5 | 664.9 | 675.2 |
| 1999 | 627.4 | 680.4 | 710.5 | 732.8 | 703.6 | 706.1 | 729.1 | 697.5 | 686.3 | 714.5 | 704.7 | 753.6 |
| 2000 | 615.3 | 685.3 | 700.7 | 701.1 | 832.4 | 967.8 | 911.1 | 926.5 | 947.0 | 961.2 | 950.8 | 991.0 |
| 2001 | 889.9 | 912.7 | 929.0 | 949.7 | 940.4 | 964.6 | 881.4 | 913.5 | W | 932.0 | 910.7 | 965.1 |
| 2002 | 856.2 | 912.7 | 926.6 | 925.5 | 936.7 | 947.9 | 937.0 | 946.1 | 934.5 | 979.6 | 968.5 | 961.7 |
| 2003 | 929.8 | 884.9 | 935.8 | 926.7 | W | W | 800.9 | 792.9 | 764.6 | 759.8 | 730.7 | 712.6 |
| 2004 | 676.0 | 676.6 | 654.1 | 646.9 | 497.0 | W | 456.8 | W | W | 588.3 | W | W |
| 2005 | W | 551.1 | W | W | W | 581.5 | W | W | 586.2 | W | 577.6 | W |
| 2006 | 540.7 | 533.3 | 536.5 | 557.9 | 524.3 | 603.9 | 592.1 | 539.2 | 519.5 | 552.9 | 553.4 | 563.8 |
| 2007 | W | 530.0 | W | W | W | W | W | W | W | W | W | W |
| 2008 | W | W | W | W | W | W | W | W | W | W | 433.7 | 464.5 |
| 2009 | W | W | W | W | W | W | W | W | W | W | W | W |
| 2010 | W | W | W | W | W | W | W | W | W | W | W | W |
| 2011 | W | W | W | W | W | 420.9 | 404.5 | 389.9 | 407.0 | 401.0 | W | W |
| 2012 | W | W | W | W | W | W | W | W | W | W | W | W |
| 2013 | W | W | W | W | W | W | W | W | W | W | NA | W |
| 2014 | W | W | W | W | W | W | W | W | W | W | W | W |
| 2015 | W | W | W | W | W | W | W | W | W | W | W | W |
| 2016 | W | W | W | W | W | W | W | W | W | W | W | W |
| 2017 | W | W | W | W | W | W | W | W | W | W | W | W |
| 2018 | W | W | W | W | W | W | W | W | W | W | W | W |
| 2019 | W | W | W | W | W | W | W | W | W | W | W | W |
| 2020 | W | W | W | W | W | W | W | W | W | W | W | W |
| 2021 | W | W | W | W | W | - | - | - | - | - | - | - |
| 2022 | - | - | - | |||||||||
| - = No Data Reported; -- = Not Applicable; NA = Not Available; W = Withheld to avoid disclosure of individual company data. |
| Release Date: 6/1/2022 |
| Next Release Date: TBD |