|
Download Data (XLS File) |
|
||||||||
|
||||||||
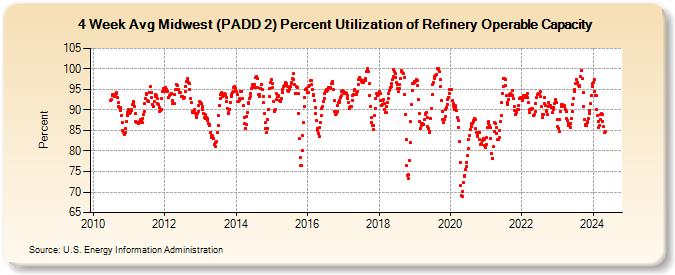
| 4-Week Avg Midwest (PADD 2) Percent Utilization of Refinery Operable Capacity (Percent) | ||||||||
| Year-Month | Week 1 | Week 2 | Week 3 | Week 4 | Week 5 | |||||||
|---|---|---|---|---|---|---|---|---|---|---|---|---|
| End Date | Value | End Date | Value | End Date | Value | End Date | Value | End Date | Value | |||
| 2010-Jun | 06/04 | - | 06/11 | - | 06/18 | - | 06/25 | 92.3 | ||||
| 2010-Jul | 07/02 | 92.6 | 07/09 | 93.7 | 07/16 | 93.6 | 07/23 | 93.6 | 07/30 | 93.7 | ||
| 2010-Aug | 08/06 | 93.3 | 08/13 | 93.8 | 08/20 | 94.3 | 08/27 | 93.9 | ||||
| 2010-Sep | 09/03 | 93.0 | 09/10 | 91.7 | 09/17 | 90.9 | 09/24 | 90.7 | ||||
| 2010-Oct | 10/01 | 90.7 | 10/08 | 89.9 | 10/15 | 88.7 | 10/22 | 87.0 | 10/29 | 85.0 | ||
| 2010-Nov | 11/05 | 84.4 | 11/12 | 84.0 | 11/19 | 84.4 | 11/26 | 85.4 | ||||
| 2010-Dec | 12/03 | 87.2 | 12/10 | 88.7 | 12/17 | 89.5 | 12/24 | 90.0 | 12/31 | 89.5 | ||
| 2011-Jan | 01/07 | 89.1 | 01/14 | 89.3 | 01/21 | 89.9 | 01/28 | 90.2 | ||||
| 2011-Feb | 02/04 | 91.3 | 02/11 | 92.1 | 02/18 | 91.5 | 02/25 | 90.9 | ||||
| 2011-Mar | 03/04 | 89.1 | 03/11 | 87.3 | 03/18 | 87.0 | 03/25 | 86.9 | ||||
| 2011-Apr | 04/01 | 86.6 | 04/08 | 86.7 | 04/15 | 87.1 | 04/22 | 86.9 | 04/29 | 87.6 | ||
| 2011-May | 05/06 | 87.5 | 05/13 | 87.0 | 05/20 | 88.0 | 05/27 | 88.8 | ||||
| 2011-Jun | 06/03 | 89.6 | 06/10 | 91.5 | 06/17 | 92.9 | 06/24 | 94.1 | ||||
| 2011-Jul | 07/01 | 93.8 | 07/08 | 92.2 | 07/15 | 92.1 | 07/22 | 92.0 | 07/29 | 94.3 | ||
| 2011-Aug | 08/05 | 95.7 | 08/12 | 94.3 | 08/19 | 93.0 | 08/26 | 91.4 | ||||
| 2011-Sep | 09/02 | 90.8 | 09/09 | 90.9 | 09/16 | 92.0 | 09/23 | 93.2 | 09/30 | 93.8 | ||
| 2011-Oct | 10/07 | 93.4 | 10/14 | 92.7 | 10/21 | 91.5 | 10/28 | 91.3 | ||||
| 2011-Nov | 11/04 | 90.6 | 11/11 | 89.6 | 11/18 | 89.9 | 11/25 | 90.1 | ||||
| 2011-Dec | 12/02 | 92.7 | 12/09 | 94.5 | 12/16 | 95.2 | 12/23 | 95.2 | 12/30 | 94.6 | ||
| 2012-Jan | 01/06 | 95.4 | 01/13 | 94.8 | 01/20 | 95.0 | 01/27 | 94.5 | ||||
| 2012-Feb | 02/03 | 93.0 | 02/10 | 93.1 | 02/17 | 93.5 | 02/24 | 93.7 | ||||
| 2012-Mar | 03/02 | 93.8 | 03/09 | 94.0 | 03/16 | 92.4 | 03/23 | 91.5 | 03/30 | 91.6 | ||
| 2012-Apr | 04/06 | 91.6 | 04/13 | 93.7 | 04/20 | 95.1 | 04/27 | 96.3 | ||||
| 2012-May | 05/04 | 96.0 | 05/11 | 94.9 | 05/18 | 94.9 | 05/25 | 94.3 | ||||
| 2012-Jun | 06/01 | 94.3 | 06/08 | 94.3 | 06/15 | 93.3 | 06/22 | 93.2 | 06/29 | 93.3 | ||
| 2012-Jul | 07/06 | 93.0 | 07/13 | 92.7 | 07/20 | 93.1 | 07/27 | 94.6 | ||||
| 2012-Aug | 08/03 | 95.8 | 08/10 | 96.9 | 08/17 | 97.6 | 08/24 | 97.3 | 08/31 | 96.6 | ||
| 2012-Sep | 09/07 | 96.5 | 09/14 | 95.1 | 09/21 | 92.9 | 09/28 | 91.7 | ||||
| 2012-Oct | 10/05 | 89.6 | 10/12 | 89.3 | 10/19 | 89.5 | 10/26 | 89.3 | ||||
| 2012-Nov | 11/02 | 90.0 | 11/09 | 89.1 | 11/16 | 88.4 | 11/23 | 88.1 | 11/30 | 89.1 | ||
| 2012-Dec | 12/07 | 89.7 | 12/14 | 91.0 | 12/21 | 92.0 | 12/28 | 91.5 | ||||
| 2013-Jan | 01/04 | 91.9 | 01/11 | 91.5 | 01/18 | 90.8 | 01/25 | 90.0 | ||||
| 2013-Feb | 02/01 | 89.2 | 02/08 | 88.1 | 02/15 | 88.0 | 02/22 | 88.8 | ||||
| 2013-Mar | 03/01 | 88.2 | 03/08 | 87.4 | 03/15 | 87.9 | 03/22 | 86.7 | 03/29 | 86.1 | ||
| 2013-Apr | 04/05 | 86.4 | 04/12 | 84.4 | 04/19 | 83.4 | 04/26 | 83.7 | ||||
| 2013-May | 05/03 | 83.7 | 05/10 | 83.0 | 05/17 | 83.0 | 05/24 | 81.6 | 05/31 | 81.2 | ||
| 2013-Jun | 06/07 | 82.0 | 06/14 | 82.2 | 06/21 | 84.5 | 06/28 | 86.3 | ||||
| 2013-Jul | 07/05 | 88.6 | 07/12 | 91.2 | 07/19 | 92.9 | 07/26 | 93.7 | ||||
| 2013-Aug | 08/02 | 94.3 | 08/09 | 93.6 | 08/16 | 93.3 | 08/23 | 93.7 | 08/30 | 93.6 | ||
| 2013-Sep | 09/06 | 94.1 | 09/13 | 93.8 | 09/20 | 93.1 | 09/27 | 92.1 | ||||
| 2013-Oct | 10/04 | 90.3 | 10/11 | 89.5 | 10/18 | 89.1 | 10/25 | 90.2 | ||||
| 2013-Nov | 11/01 | 91.9 | 11/08 | 93.2 | 11/15 | 93.7 | 11/22 | 94.3 | 11/29 | 94.5 | ||
| 2013-Dec | 12/06 | 95.5 | 12/13 | 95.7 | 12/20 | 95.3 | 12/27 | 95.3 | ||||
| 2014-Jan | 01/03 | 94.4 | 01/10 | 93.8 | 01/17 | 92.1 | 01/24 | 92.0 | 01/31 | 92.2 | ||
| 2014-Feb | 02/07 | 92.8 | 02/14 | 94.6 | 02/21 | 94.5 | 02/28 | 94.6 | ||||
| 2014-Mar | 03/07 | 92.7 | 03/14 | 91.1 | 03/21 | 88.2 | 03/28 | 86.6 | ||||
| 2014-Apr | 04/04 | 85.6 | 04/11 | 86.5 | 04/18 | 88.5 | 04/25 | 89.4 | ||||
| 2014-May | 05/02 | 91.5 | 05/09 | 91.7 | 05/16 | 92.7 | 05/23 | 93.2 | 05/30 | 94.1 | ||
| 2014-Jun | 06/06 | 95.3 | 06/13 | 96.1 | 06/20 | 95.8 | 06/27 | 95.9 | ||||
| 2014-Jul | 07/04 | 95.5 | 07/11 | 96.2 | 07/18 | 97.8 | 07/25 | 98.1 | ||||
| 2014-Aug | 08/01 | 97.7 | 08/08 | 95.5 | 08/15 | 93.8 | 08/22 | 93.3 | 08/29 | 93.8 | ||
| 2014-Sep | 09/05 | 95.3 | 09/12 | 96.1 | 09/19 | 96.1 | 09/26 | 94.9 | ||||
| 2014-Oct | 10/03 | 93.3 | 10/10 | 91.8 | 10/17 | 89.2 | 10/24 | 86.9 | 10/31 | 85.4 | ||
| 2014-Nov | 11/07 | 84.4 | 11/14 | 85.4 | 11/21 | 87.6 | 11/28 | 90.0 | ||||
| 2014-Dec | 12/05 | 93.3 | 12/12 | 95.3 | 12/19 | 96.8 | 12/26 | 97.4 | ||||
| 2015-Jan | 01/02 | 96.4 | 01/09 | 95.4 | 01/16 | 92.1 | 01/23 | 89.7 | 01/30 | 89.8 | ||
| 2015-Feb | 02/06 | 90.1 | 02/13 | 92.5 | 02/20 | 93.9 | 02/27 | 93.2 | ||||
| 2015-Mar | 03/06 | 93.2 | 03/13 | 93.4 | 03/20 | 92.2 | 03/27 | 92.0 | ||||
| 2015-Apr | 04/03 | 92.1 | 04/10 | 92.7 | 04/17 | 94.3 | 04/24 | 95.0 | ||||
| 2015-May | 05/01 | 95.7 | 05/08 | 96.0 | 05/15 | 96.3 | 05/22 | 96.7 | 05/29 | 96.4 | ||
| 2015-Jun | 06/05 | 95.7 | 06/12 | 94.8 | 06/19 | 94.5 | 06/26 | 94.9 | ||||
| 2015-Jul | 07/03 | 95.5 | 07/10 | 95.7 | 07/17 | 96.4 | 07/24 | 96.8 | 07/31 | 97.6 | ||
| 2015-Aug | 08/07 | 98.8 | 08/14 | 97.5 | 08/21 | 96.1 | 08/28 | 94.1 | ||||
| 2015-Sep | 09/04 | 94.0 | 09/11 | 95.6 | 09/18 | 95.4 | 09/25 | 94.0 | ||||
| 2015-Oct | 10/02 | 89.2 | 10/09 | 83.0 | 10/16 | 78.3 | 10/23 | 76.5 | 10/30 | 76.5 | ||
| 2015-Nov | 11/06 | 80.1 | 11/13 | 83.7 | 11/20 | 86.9 | 11/27 | 90.8 | ||||
| 2015-Dec | 12/04 | 93.0 | 12/11 | 94.9 | 12/18 | 94.9 | 12/25 | 95.2 | ||||
| 2016-Jan | 01/01 | 94.2 | 01/08 | 94.2 | 01/15 | 95.7 | 01/22 | 95.9 | 01/29 | 97.1 | ||
| 2016-Feb | 02/05 | 97.1 | 02/12 | 96.2 | 02/19 | 95.1 | 02/26 | 93.7 | ||||
| 2016-Mar | 03/04 | 93.4 | 03/11 | 92.3 | 03/18 | 90.5 | 03/25 | 89.1 | ||||
| 2016-Apr | 04/01 | 87.4 | 04/08 | 85.5 | 04/15 | 84.9 | 04/22 | 84.3 | 04/29 | 83.6 | ||
| 2016-May | 05/06 | 85.7 | 05/13 | 87.0 | 05/20 | 88.7 | 05/27 | 90.3 | ||||
| 2016-Jun | 06/03 | 90.9 | 06/10 | 92.0 | 06/17 | 92.9 | 06/24 | 93.9 | ||||
| 2016-Jul | 07/01 | 94.5 | 07/08 | 94.4 | 07/15 | 95.0 | 07/22 | 94.8 | 07/29 | 95.4 | ||
| 2016-Aug | 08/05 | 95.5 | 08/12 | 95.3 | 08/19 | 95.5 | 08/26 | 95.3 | ||||
| 2016-Sep | 09/02 | 96.5 | 09/09 | 97.0 | 09/16 | 96.4 | 09/23 | 94.9 | 09/30 | 92.3 | ||
| 2016-Oct | 10/07 | 89.6 | 10/14 | 88.8 | 10/21 | 89.1 | 10/28 | 89.6 | ||||
| 2016-Nov | 11/04 | 91.1 | 11/11 | 91.8 | 11/18 | 91.7 | 11/25 | 92.2 | ||||
| 2016-Dec | 12/02 | 93.0 | 12/09 | 93.4 | 12/16 | 94.4 | 12/23 | 94.8 | 12/30 | 94.4 | ||
| 2017-Jan | 01/06 | 94.3 | 01/13 | 94.0 | 01/20 | 93.9 | 01/27 | 94.2 | ||||
| 2017-Feb | 02/03 | 94.1 | 02/10 | 93.5 | 02/17 | 92.7 | 02/24 | 91.9 | ||||
| 2017-Mar | 03/03 | 90.7 | 03/10 | 90.3 | 03/17 | 90.8 | 03/24 | 90.9 | 03/31 | 92.4 | ||
| 2017-Apr | 04/07 | 93.4 | 04/14 | 93.8 | 04/21 | 94.7 | 04/28 | 95.0 | ||||
| 2017-May | 05/05 | 93.7 | 05/12 | 93.7 | 05/19 | 93.9 | 05/26 | 94.5 | ||||
| 2017-Jun | 06/02 | 96.3 | 06/09 | 97.5 | 06/16 | 98.0 | 06/23 | 97.3 | 06/30 | 97.3 | ||
| 2017-Jul | 07/07 | 97.0 | 07/14 | 96.8 | 07/21 | 97.1 | 07/28 | 96.7 | ||||
| 2017-Aug | 08/04 | 97.2 | 08/11 | 97.2 | 08/18 | 97.7 | 08/25 | 99.3 | ||||
| 2017-Sep | 09/01 | 99.8 | 09/08 | 100.2 | 09/15 | 99.3 | 09/22 | 96.4 | 09/29 | 93.5 | ||
| 2017-Oct | 10/06 | 90.9 | 10/13 | 88.1 | 10/20 | 86.9 | 10/27 | 86.1 | ||||
| 2017-Nov | 11/03 | 85.2 | 11/10 | 86.2 | 11/17 | 88.6 | 11/24 | 90.4 | ||||
| 2017-Dec | 12/01 | 92.9 | 12/08 | 94.0 | 12/15 | 93.4 | 12/22 | 93.7 | 12/29 | 93.9 | ||
| 2018-Jan | 01/05 | 94.4 | 01/12 | 93.9 | 01/19 | 92.2 | 01/26 | 91.2 | ||||
| 2018-Feb | 02/02 | 91.4 | 02/09 | 92.2 | 02/16 | 92.6 | 02/23 | 91.5 | ||||
| 2018-Mar | 03/02 | 90.2 | 03/09 | 89.3 | 03/16 | 89.4 | 03/23 | 90.8 | 03/30 | 91.8 | ||
| 2018-Apr | 04/06 | 92.8 | 04/13 | 93.9 | 04/20 | 94.8 | 04/27 | 95.4 | ||||
| 2018-May | 05/04 | 95.7 | 05/11 | 96.5 | 05/18 | 97.3 | 05/25 | 98.2 | ||||
| 2018-Jun | 06/01 | 99.8 | 06/08 | 99.4 | 06/15 | 98.8 | 06/22 | 98.0 | 06/29 | 96.8 | ||
| 2018-Jul | 07/06 | 96.3 | 07/13 | 95.3 | 07/20 | 94.4 | 07/27 | 95.2 | ||||
| 2018-Aug | 08/03 | 96.2 | 08/10 | 97.7 | 08/17 | 99.3 | 08/24 | 99.5 | 08/31 | 99.1 | ||
| 2018-Sep | 09/07 | 98.8 | 09/14 | 97.9 | 09/21 | 93.7 | 09/28 | 88.9 | ||||
| 2018-Oct | 10/05 | 82.9 | 10/12 | 76.4 | 10/19 | 74.1 | 10/26 | 73.2 | ||||
| 2018-Nov | 11/02 | 74.2 | 11/09 | 77.7 | 11/16 | 82.0 | 11/23 | 87.1 | 11/30 | 91.3 | ||
| 2018-Dec | 12/07 | 94.8 | 12/14 | 96.4 | 12/21 | 96.4 | 12/28 | 97.0 | ||||
| 2019-Jan | 01/04 | 96.8 | 01/11 | 96.9 | 01/18 | 97.5 | 01/25 | 97.1 | ||||
| 2019-Feb | 02/01 | 96.0 | 02/08 | 92.6 | 02/15 | 89.2 | 02/22 | 87.3 | ||||
| 2019-Mar | 03/01 | 85.6 | 03/08 | 86.2 | 03/15 | 86.8 | 03/22 | 86.7 | 03/29 | 86.4 | ||
| 2019-Apr | 04/05 | 86.4 | 04/12 | 87.6 | 04/19 | 88.8 | 04/26 | 89.1 | ||||
| 2019-May | 05/03 | 89.4 | 05/10 | 88.1 | 05/17 | 85.9 | 05/24 | 85.5 | 05/31 | 84.5 | ||
| 2019-Jun | 06/07 | 84.7 | 06/14 | 88.0 | 06/21 | 90.3 | 06/28 | 93.7 | ||||
| 2019-Jul | 07/05 | 96.1 | 07/12 | 96.6 | 07/19 | 98.2 | 07/26 | 97.6 | ||||
| 2019-Aug | 08/02 | 98.3 | 08/09 | 98.6 | 08/16 | 98.7 | 08/23 | 100.1 | 08/30 | 99.8 | ||
| 2019-Sep | 09/06 | 100.0 | 09/13 | 99.3 | 09/20 | 97.3 | 09/27 | 95.6 | ||||
| 2019-Oct | 10/04 | 92.4 | 10/11 | 89.7 | 10/18 | 87.6 | 10/25 | 86.9 | ||||
| 2019-Nov | 11/01 | 87.7 | 11/08 | 88.5 | 11/15 | 90.2 | 11/22 | 90.5 | 11/29 | 91.4 | ||
| 2019-Dec | 12/06 | 92.6 | 12/13 | 93.1 | 12/20 | 94.1 | 12/27 | 94.9 | ||||
| 2020-Jan | 01/03 | 94.9 | 01/10 | 95.0 | 01/17 | 94.9 | 01/24 | 92.4 | 01/31 | 91.5 | ||
| 2020-Feb | 02/07 | 90.9 | 02/14 | 90.2 | 02/21 | 91.0 | 02/28 | 90.6 | ||||
| 2020-Mar | 03/06 | 89.8 | 03/13 | 88.2 | 03/20 | 87.5 | 03/27 | 85.7 | ||||
| 2020-Apr | 04/03 | 82.3 | 04/10 | 77.3 | 04/17 | 71.5 | 04/24 | 69.1 | ||||
| 2020-May | 05/01 | 69.0 | 05/08 | 70.2 | 05/15 | 72.3 | 05/22 | 73.7 | 05/29 | 74.1 | ||
| 2020-Jun | 06/05 | 75.5 | 06/12 | 76.2 | 06/19 | 77.3 | 06/26 | 78.8 | ||||
| 2020-Jul | 07/03 | 80.6 | 07/10 | 82.8 | 07/17 | 83.8 | 07/24 | 85.2 | 07/31 | 86.0 | ||
| 2020-Aug | 08/07 | 86.7 | 08/14 | 86.8 | 08/21 | 87.1 | 08/28 | 87.5 | ||||
| 2020-Sep | 09/04 | 87.9 | 09/11 | 87.7 | 09/18 | 85.4 | 09/25 | 84.5 | ||||
| 2020-Oct | 10/02 | 83.7 | 10/09 | 83.5 | 10/16 | 84.4 | 10/23 | 84.4 | 10/30 | 82.8 | ||
| 2020-Nov | 11/06 | 81.7 | 11/13 | 81.8 | 11/20 | 81.6 | 11/27 | 82.5 | ||||
| 2020-Dec | 12/04 | 83.1 | 12/11 | 82.8 | 12/18 | 81.4 | 12/25 | 80.9 | ||||
| 2021-Jan | 01/01 | 81.7 | 01/08 | 83.2 | 01/15 | 85.7 | 01/22 | 87.1 | 01/29 | 86.8 | ||
| 2021-Feb | 02/05 | 86.3 | 02/12 | 85.7 | 02/19 | 83.0 | 02/26 | 79.5 | ||||
| 2021-Mar | 03/05 | 78.2 | 03/12 | 78.2 | 03/19 | 81.0 | 03/26 | 84.8 | ||||
| 2021-Apr | 04/02 | 87.0 | 04/09 | 86.7 | 04/16 | 85.7 | 04/23 | 84.3 | 04/30 | 82.8 | ||
| 2021-May | 05/07 | 82.8 | 05/14 | 83.2 | 05/21 | 85.0 | 05/28 | 87.2 | ||||
| 2021-Jun | 06/04 | 88.7 | 06/11 | 91.8 | 06/18 | 94.1 | 06/25 | 95.8 | ||||
| 2021-Jul | 07/02 | 97.7 | 07/09 | 97.6 | 07/16 | 97.4 | 07/23 | 95.9 | 07/30 | 93.5 | ||
| 2021-Aug | 08/06 | 91.9 | 08/13 | 91.4 | 08/20 | 92.6 | 08/27 | 93.8 | ||||
| 2021-Sep | 09/03 | 93.4 | 09/10 | 93.9 | 09/17 | 93.7 | 09/24 | 93.5 | ||||
| 2021-Oct | 10/01 | 94.8 | 10/08 | 92.7 | 10/15 | 90.9 | 10/22 | 89.9 | 10/29 | 88.9 | ||
| 2021-Nov | 11/05 | 89.6 | 11/12 | 89.4 | 11/19 | 90.1 | 11/26 | 90.1 | ||||
| 2021-Dec | 12/03 | 91.1 | 12/10 | 92.7 | 12/17 | 92.8 | 12/24 | 93.1 | 12/31 | 92.7 | ||
| 2022-Jan | 01/07 | 92.4 | 01/14 | 92.8 | 01/21 | 93.6 | 01/28 | 93.3 | ||||
| 2022-Feb | 02/04 | 93.4 | 02/11 | 93.0 | 02/18 | 93.5 | 02/25 | 94.0 | ||||
| 2022-Mar | 03/04 | 93.0 | 03/11 | 91.8 | 03/18 | 90.0 | 03/25 | 89.4 | ||||
| 2022-Apr | 04/01 | 90.1 | 04/08 | 90.2 | 04/15 | 90.4 | 04/22 | 90.3 | 04/29 | 88.7 | ||
| 2022-May | 05/06 | 88.7 | 05/13 | 88.8 | 05/20 | 89.6 | 05/27 | 91.5 | ||||
| 2022-Jun | 06/03 | 93.0 | 06/10 | 93.8 | 06/17 | 93.9 | 06/24 | 94.0 | ||||
| 2022-Jul | 07/01 | 94.1 | 07/08 | 94.4 | 07/15 | 93.2 | 07/22 | 90.9 | 07/29 | 89.0 | ||
| 2022-Aug | 08/05 | 88.2 | 08/12 | 89.0 | 08/19 | 91.5 | 08/26 | 93.0 | ||||
| 2022-Sep | 09/02 | 91.0 | 09/09 | 89.8 | 09/16 | 89.7 | 09/23 | 88.8 | 09/30 | 90.9 | ||
| 2022-Oct | 10/07 | 91.8 | 10/14 | 91.1 | 10/21 | 91.1 | 10/28 | 90.7 | ||||
| 2022-Nov | 11/04 | 90.5 | 11/11 | 89.4 | 11/18 | 90.0 | 11/25 | 90.7 | ||||
| 2022-Dec | 12/02 | 91.6 | 12/09 | 92.6 | 12/16 | 91.8 | 12/23 | 91.7 | 12/30 | 87.7 | ||
| 2023-Jan | 01/06 | 86.0 | 01/13 | 85.5 | 01/20 | 84.7 | 01/27 | 87.6 | ||||
| 2023-Feb | 02/03 | 89.6 | 02/10 | 90.9 | 02/17 | 91.3 | 02/24 | 91.3 | ||||
| 2023-Mar | 03/03 | 91.0 | 03/10 | 91.1 | 03/17 | 90.8 | 03/24 | 90.2 | 03/31 | 89.6 | ||
| 2023-Apr | 04/07 | 87.8 | 04/14 | 87.5 | 04/21 | 86.8 | 04/28 | 86.1 | ||||
| 2023-May | 05/05 | 86.1 | 05/12 | 85.8 | 05/19 | 86.8 | 05/26 | 88.0 | ||||
| 2023-Jun | 06/02 | 89.7 | 06/09 | 91.4 | 06/16 | 92.9 | 06/23 | 94.4 | 06/30 | 95.0 | ||
| 2023-Jul | 07/07 | 96.5 | 07/14 | 97.3 | 07/21 | 97.5 | 07/28 | 96.7 | ||||
| 2023-Aug | 08/04 | 96.0 | 08/11 | 95.7 | 08/18 | 96.0 | 08/25 | 98.2 | ||||
| 2023-Sep | 09/01 | 99.5 | 09/08 | 99.7 | 09/15 | 97.6 | 09/22 | 94.2 | 09/29 | 90.8 | ||
| 2023-Oct | 10/06 | 87.6 | 10/13 | 86.5 | 10/20 | 86.1 | 10/27 | 86.1 | ||||
| 2023-Nov | 11/03 | 86.9 | 11/10 | 87.2 | 11/17 | 87.8 | 11/24 | 89.2 | ||||
| 2023-Dec | 12/01 | 89.8 | 12/08 | 91.5 | 12/15 | 93.5 | 12/22 | 95.6 | 12/29 | 96.4 | ||
| 2024-Jan | 01/05 | 96.8 | 01/12 | 97.3 | 01/19 | 94.6 | 01/26 | 93.6 | ||||
| 2024-Feb | 02/02 | 93.5 | 02/09 | 90.0 | 02/16 | 88.6 | 02/23 | 87.3 | ||||
| 2024-Mar | 03/01 | 85.7 | 03/08 | 86.1 | 03/15 | 87.7 | 03/22 | 88.8 | 03/29 | 89.1 | ||
| 2024-Apr | 04/05 | 89.0 | 04/12 | 87.3 | 04/19 | 85.9 | ||||||
| - = No Data Reported; -- = Not Applicable; NA = Not Available; W = Withheld to avoid disclosure of individual company data. |
| Release Date: 4/24/2024 |
| Next Release Date: 5/1/2024 |