|
Download Data (XLS File) |
|
||||||||
|
||||||||
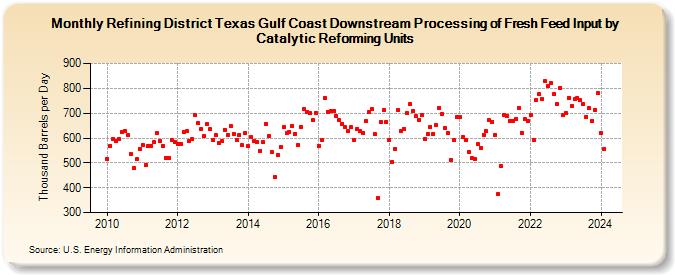
| Refining District Texas Gulf Coast Downstream Processing of Fresh Feed Input by Catalytic Reforming Units (Thousand Barrels per Day) | ||||||||
| Year | Jan | Feb | Mar | Apr | May | Jun | Jul | Aug | Sep | Oct | Nov | Dec |
|---|---|---|---|---|---|---|---|---|---|---|---|---|
| 2010 | 516 | 568 | 598 | 590 | 595 | 625 | 629 | 611 | 536 | 480 | 514 | 557 |
| 2011 | 572 | 492 | 567 | 568 | 582 | 620 | 590 | 569 | 521 | 520 | 591 | 582 |
| 2012 | 575 | 577 | 626 | 627 | 588 | 596 | 691 | 660 | 635 | 608 | 657 | 635 |
| 2013 | 591 | 611 | 581 | 587 | 634 | 613 | 648 | 617 | 593 | 612 | 570 | 621 |
| 2014 | 568 | 603 | 589 | 583 | 549 | 584 | 657 | 607 | 543 | 443 | 532 | 565 |
| 2015 | 643 | 619 | 626 | 648 | 618 | 571 | 646 | 715 | 703 | 699 | 673 | 701 |
| 2016 | 569 | 594 | 763 | 705 | 709 | 708 | 689 | 671 | 658 | 643 | 627 | 643 |
| 2017 | 594 | 638 | 629 | 621 | 668 | 706 | 716 | 616 | 360 | 665 | 712 | 665 |
| 2018 | 593 | 504 | 556 | 713 | 627 | 638 | 700 | 735 | 708 | 687 | 674 | 694 |
| 2019 | 596 | 617 | 646 | 618 | 651 | 721 | 698 | 642 | 621 | 513 | 591 | 685 |
| 2020 | 683 | 605 | 592 | 544 | 519 | 517 | 574 | 561 | 614 | 627 | 671 | 666 |
| 2021 | 614 | 374 | 487 | 693 | 687 | 669 | 669 | 676 | 721 | 621 | 676 | 668 |
| 2022 | 693 | 594 | 753 | 776 | 757 | 828 | 811 | 821 | 778 | 735 | 803 | 692 |
| 2023 | 699 | 763 | 730 | 757 | 762 | 752 | 737 | 686 | 719 | 670 | 714 | 781 |
| 2024 | 620 | |||||||||||
| - = No Data Reported; -- = Not Applicable; NA = Not Available; W = Withheld to avoid disclosure of individual company data. |
| Release Date: 3/29/2024 |
| Next Release Date: 4/30/2024 |