|
Download Data (XLS File) |
|
||||||||
|
||||||||
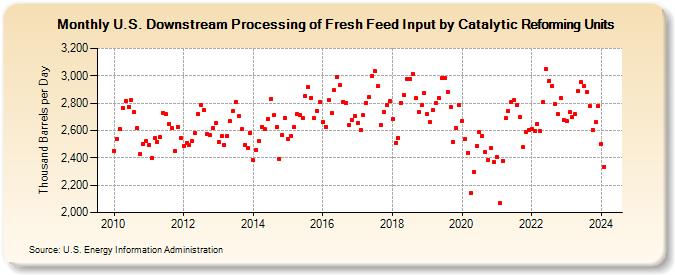
| U.S. Downstream Processing of Fresh Feed Input by Catalytic Reforming Units (Thousand Barrels per Day) | ||||||||
| Year | Jan | Feb | Mar | Apr | May | Jun | Jul | Aug | Sep | Oct | Nov | Dec |
|---|---|---|---|---|---|---|---|---|---|---|---|---|
| 2010 | 2,452 | 2,541 | 2,611 | 2,765 | 2,815 | 2,774 | 2,826 | 2,735 | 2,616 | 2,428 | 2,501 | 2,520 |
| 2011 | 2,497 | 2,400 | 2,545 | 2,519 | 2,549 | 2,730 | 2,719 | 2,646 | 2,616 | 2,447 | 2,629 | 2,545 |
| 2012 | 2,487 | 2,511 | 2,491 | 2,526 | 2,580 | 2,721 | 2,785 | 2,749 | 2,574 | 2,568 | 2,617 | 2,655 |
| 2013 | 2,515 | 2,558 | 2,494 | 2,562 | 2,666 | 2,739 | 2,806 | 2,703 | 2,608 | 2,494 | 2,474 | 2,584 |
| 2014 | 2,382 | 2,458 | 2,520 | 2,626 | 2,608 | 2,684 | 2,827 | 2,711 | 2,626 | 2,394 | 2,566 | 2,692 |
| 2015 | 2,537 | 2,563 | 2,624 | 2,717 | 2,714 | 2,689 | 2,853 | 2,915 | 2,841 | 2,688 | 2,746 | 2,810 |
| 2016 | 2,663 | 2,629 | 2,824 | 2,727 | 2,894 | 2,994 | 2,931 | 2,810 | 2,801 | 2,642 | 2,676 | 2,707 |
| 2017 | 2,657 | 2,602 | 2,710 | 2,802 | 2,847 | 3,000 | 3,034 | 2,924 | 2,642 | 2,732 | 2,787 | 2,815 |
| 2018 | 2,682 | 2,510 | 2,545 | 2,803 | 2,858 | 2,974 | 2,976 | 3,016 | 2,837 | 2,736 | 2,785 | 2,875 |
| 2019 | 2,719 | 2,659 | 2,748 | 2,802 | 2,838 | 2,980 | 2,984 | 2,883 | 2,772 | 2,517 | 2,621 | 2,786 |
| 2020 | 2,669 | 2,537 | 2,439 | 2,141 | 2,297 | 2,486 | 2,587 | 2,560 | 2,443 | 2,383 | 2,472 | 2,369 |
| 2021 | 2,405 | 2,069 | 2,379 | 2,689 | 2,741 | 2,805 | 2,823 | 2,788 | 2,701 | 2,477 | 2,589 | 2,603 |
| 2022 | 2,611 | 2,596 | 2,648 | 2,596 | 2,805 | 3,049 | 2,963 | 2,924 | 2,793 | 2,718 | 2,838 | 2,675 |
| 2023 | 2,670 | 2,734 | 2,699 | 2,718 | 2,885 | 2,951 | 2,923 | 2,878 | 2,779 | 2,605 | 2,663 | 2,780 |
| 2024 | 2,501 | |||||||||||
| - = No Data Reported; -- = Not Applicable; NA = Not Available; W = Withheld to avoid disclosure of individual company data. |
| Release Date: 3/29/2024 |
| Next Release Date: 4/30/2024 |