|
Download Data (XLS File) |
|
||||||||
|
||||||||
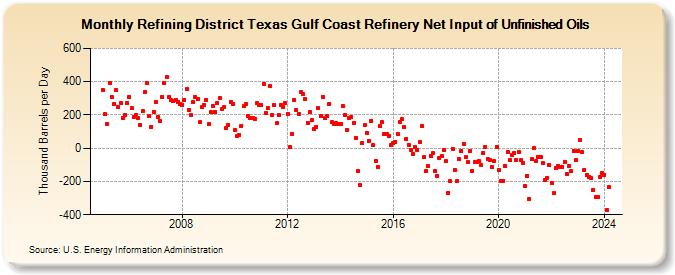
| Refining District Texas Gulf Coast Refinery Net Input of Unfinished Oils (Thousand Barrels per Day) | ||||||||
| Year | Jan | Feb | Mar | Apr | May | Jun | Jul | Aug | Sep | Oct | Nov | Dec |
|---|---|---|---|---|---|---|---|---|---|---|---|---|
| 2005 | 350 | 204 | 148 | 391 | 310 | 265 | 351 | 246 | 272 | 184 | 199 | 270 |
| 2006 | 310 | 242 | 188 | 199 | 182 | 141 | 221 | 335 | 390 | 191 | 129 | 219 |
| 2007 | 277 | 190 | 164 | 309 | 393 | 427 | 308 | 287 | 282 | 289 | 280 | 267 |
| 2008 | 262 | 290 | 355 | 231 | 201 | 276 | 309 | 296 | 155 | 246 | 260 | 291 |
| 2009 | 145 | 217 | 255 | 217 | 272 | 300 | 234 | 246 | 119 | 141 | 278 | 263 |
| 2010 | 109 | 76 | 81 | 132 | 251 | 266 | 192 | 180 | 184 | 178 | 269 | 258 |
| 2011 | 259 | 386 | 212 | 240 | 373 | 202 | 259 | 150 | 201 | 261 | 246 | 269 |
| 2012 | 207 | 6 | 85 | 291 | 229 | 206 | 335 | 325 | 294 | 153 | 216 | 169 |
| 2013 | 118 | 129 | 240 | 194 | 310 | 179 | 191 | 267 | 155 | 148 | 153 | 143 |
| 2014 | 148 | 253 | 200 | 112 | 181 | 187 | 154 | 63 | -138 | -224 | 32 | 137 |
| 2015 | 92 | 46 | 166 | 19 | -76 | -112 | 133 | 155 | 83 | 86 | 71 | 22 |
| 2016 | 29 | 36 | 86 | 160 | 173 | 128 | 57 | 21 | -9 | -33 | 7 | -10 |
| 2017 | 35 | 132 | -56 | -140 | -106 | -44 | -31 | -139 | -167 | -59 | -47 | -10 |
| 2018 | -80 | -267 | -199 | -2 | -130 | -197 | -64 | -19 | 26 | -56 | -85 | -15 |
| 2019 | -137 | -83 | -81 | -80 | -104 | -30 | 9 | -68 | -70 | -116 | -80 | 7 |
| 2020 | -130 | -198 | -196 | -107 | -21 | -74 | -39 | -30 | -71 | -25 | -74 | -90 |
| 2021 | -228 | -165 | -307 | -65 | 2 | -78 | -54 | -51 | -88 | -191 | -178 | -102 |
| 2022 | -207 | -271 | -118 | -105 | -115 | -112 | -83 | -157 | -107 | -139 | -18 | -73 |
| 2023 | -15 | 47 | -23 | -129 | -162 | -175 | -180 | -249 | -294 | -293 | -174 | -148 |
| 2024 | -161 | -373 | ||||||||||
| - = No Data Reported; -- = Not Applicable; NA = Not Available; W = Withheld to avoid disclosure of individual company data. |
| Release Date: 4/30/2024 |
| Next Release Date: 5/31/2024 |