|
Download Data (XLS File) |
|
||||||||
|
||||||||
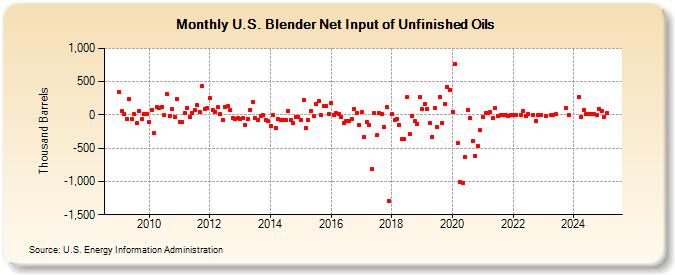
| U.S. Blender Net Input of Unfinished Oils (Thousand Barrels) | ||||||||
| Year | Jan | Feb | Mar | Apr | May | Jun | Jul | Aug | Sep | Oct | Nov | Dec |
|---|---|---|---|---|---|---|---|---|---|---|---|---|
| 2009 | 341 | 55 | 14 | -57 | 235 | -63 | 13 | -128 | 59 | -58 | 10 | 8 |
| 2010 | -113 | 80 | -279 | 121 | 98 | 124 | -5 | 313 | -16 | 82 | -26 | 243 |
| 2011 | -102 | -111 | 25 | 109 | -27 | 32 | 71 | 145 | 48 | 429 | 89 | 97 |
| 2012 | 251 | 81 | 39 | 115 | 12 | -73 | 124 | 134 | 69 | -46 | -63 | -39 |
| 2013 | -56 | -50 | -150 | -59 | 78 | 188 | -49 | -69 | -14 | -8 | -80 | -96 |
| 2014 | -160 | -5 | -193 | -67 | -70 | -72 | -70 | 61 | -83 | -118 | -35 | -25 |
| 2015 | -73 | 225 | -196 | -73 | 57 | -17 | 160 | 205 | -2 | 136 | 135 | 21 |
| 2016 | 173 | 6 | 31 | 7 | -29 | -115 | -85 | -86 | -65 | 96 | 26 | -145 |
| 2017 | 44 | -332 | -100 | -146 | -806 | 22 | -308 | 32 | 13 | -180 | 117 | -1,288 |
| 2018 | 11 | -82 | -60 | -154 | -362 | -369 | 262 | -285 | -9 | -96 | -130 | 264 |
| 2019 | 83 | 161 | 93 | -125 | -328 | 99 | -181 | 265 | -121 | 161 | 415 | 376 |
| 2020 | 49 | 767 | -428 | -1,012 | -1,020 | -628 | 71 | -43 | -393 | -615 | -461 | -227 |
| 2021 | -28 | 30 | 25 | 47 | -52 | 97 | -17 | 2 | 2 | 0 | -14 | 0 |
| 2022 | 3 | 0 | 2 | 56 | -12 | 11 | 4 | -97 | 4 | 1 | ||
| 2023 | -9 | -5 | 5 | 7 | 97 | 1 | ||||||
| - = No Data Reported; -- = Not Applicable; NA = Not Available; W = Withheld to avoid disclosure of individual company data. |
| Release Date: 4/30/2024 |
| Next Release Date: 5/31/2024 |
Referring Pages: